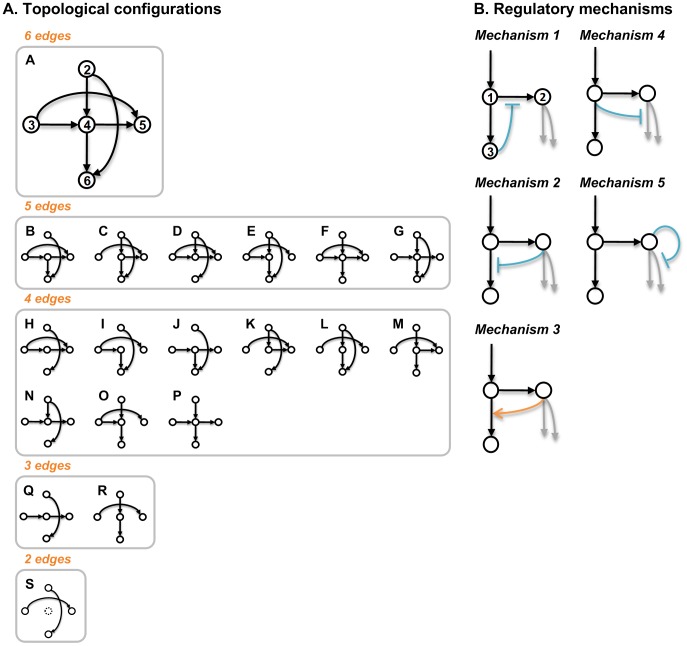
Figure 3. Lists of topological configurations and regulatory mechanisms.
Panel A: The topological configurations differ in their numbers of edges. Panel B: The orange arrows represent activation processes, whereas the blocked lines (aqua) represent inhibition processes. Arrows colored in gray are reactions included in only some specific topological configurations. Metabolite names:  1 caffeoyl CoA;
  , caffeyl aldehyde;
  feruloyl CoA;
  coniferyl aldehyde;
  coniferyl alcohol;
  5-hydroxyconiferyl aldehyde.

