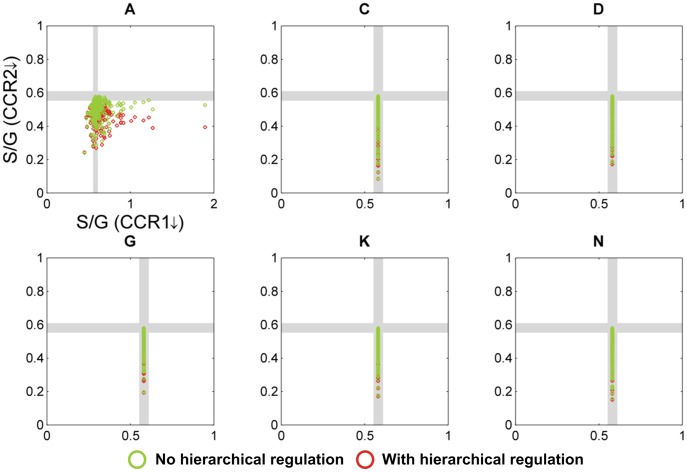
Figure 4. Simulation results for pathway designs without crosstalk.
Each of the 6 panels represents one topological configuration (as indicated with labels (A, C, D, G, K, N) corresponding to model designs in Figure 3) with at least one randomly parameterized S-system model that yields quantitatively correct predictions of S/G ratios for both CCoAOMT and COMT down-regulated alfalfa plants. Each open circle refers to the S/G ratio of CCR1 and CCR2 in a M. truncatula knockout mutant, as predicted by one randomly parameterized S-system model; its color indicates the type of regulation. The gray strips denote regions within 5% of the wild-type level; model predictions within these strips are considered essentially the same as wild-type. Qualitatively correct predictions should fall into the northwest quadrant. It is evident that not a single model instantiation is admissible. The total number of randomly parameterized model instantiations per panel was 105.

