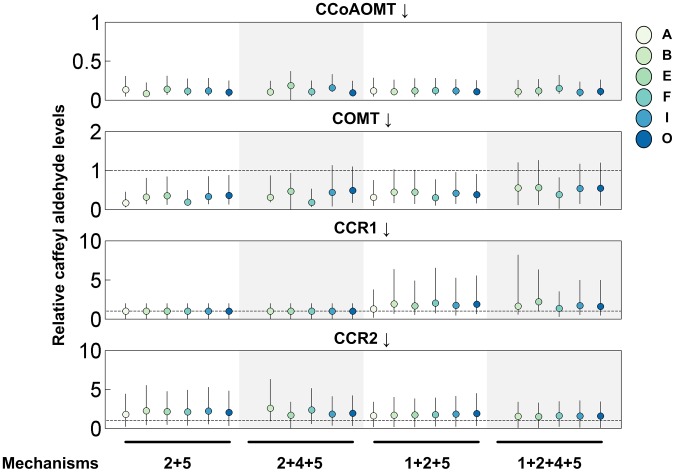
Figure 9. Relative levels of caffeyl aldehyde (compared to wild-type values) in simulations of four down-regulated lines.
Each panel is shaded to highlight the results from four different crosstalk patterns. These patterns, when combined with specific topological configurations, give rise to designs with valid model instantiations (cf. rows with red circles in Figure 8). In contrast to the other three perturbation schemes, where all four crosstalk patterns (and their corresponding designs) exhibit similar responses regarding the caffeyl aldehyde level, knocking out ccr1 is associated with a higher caffeyl aldehyde level only for the two crosstalk patterns including Mechanism 1. The circles, colored according to topological configuration, are the medians, and the error bars represent interquartile ranges. The dashed line in each panel, if present, denotes the wild-type level of caffeyl aldehyde.

