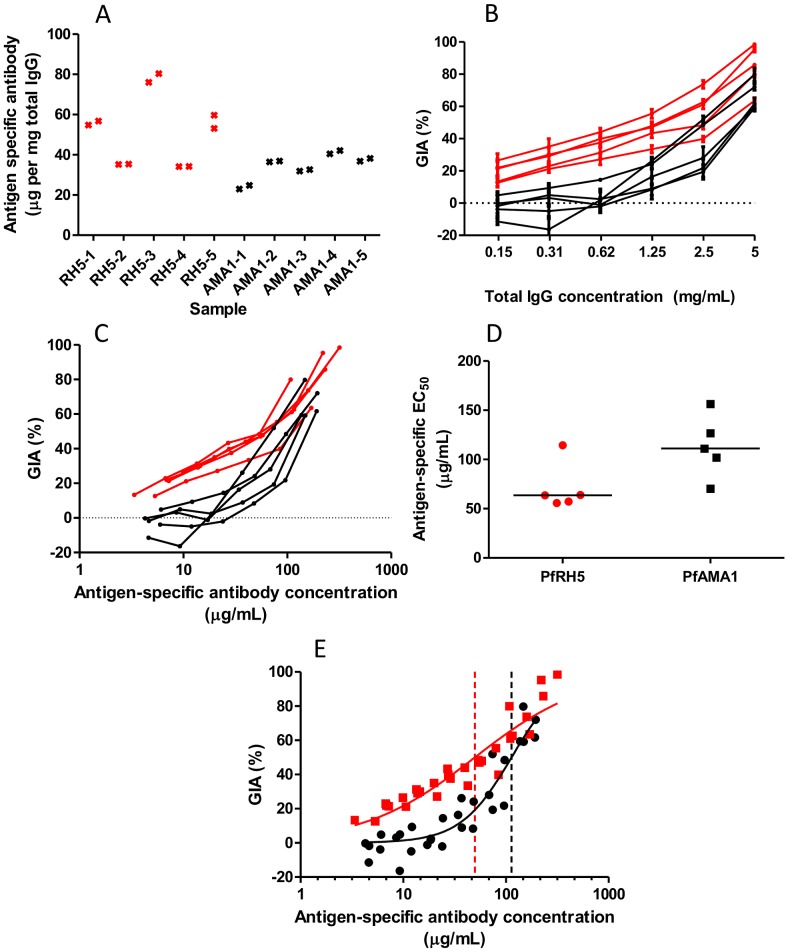
Figure 1. Measurement of GIA EC50 of antigen-specific anti-PfRH5 and anti-PfAMA1 polyclonal rabbit antibodies.
Panel A - CFCA-measured antigen-specific antibody as a proportion of total IgG (measured by spectrometry) for each of ten rabbits. Individual points indicate mean of three measurements. Panel B - GIA vs. total IgG concentration, with lines connecting data for each of five PfRH5-vaccinated rabbits (red) and five PfAMA1-vaccinated rabbits (black). Each point is the mean of three replicate wells in two independent experiments, i.e. n = 6. Error bars indicate SEM. Panel C - GIA (from the experiments depicted in panel B) vs. antigen-specific antibody concentration (calculated for each sample using the data in panel A), for each of five PfRH5-vaccinated rabbits (red) and five PfAMA1-vaccinated rabbits (black). Each point is the mean of triplicate wells in two independent experiments. Panel D - antigen-specific antibody EC50 values for PfRH5 and PfAMA1, calculated by interpolation from the data in panel C. Individual data-points and the median are shown. Panel E - Dose-response curve fitted to all GIA vs. antigen-specific antibody concentration data for the 3D7 parasite clone (multiple IgG dilutions for each of five rabbits for PfRH5 and PfAMA1). Dashed vertical lines indicate the fitted EC50 value for anti-PfRH5 (red) or anti-PfAMA1 (black) IgG. Each GIA value is the mean of triplicate wells in each of two experiments (n = 6). Red indicates anti-PfRH5 samples; black indicates anti-PfAMA1 samples.

