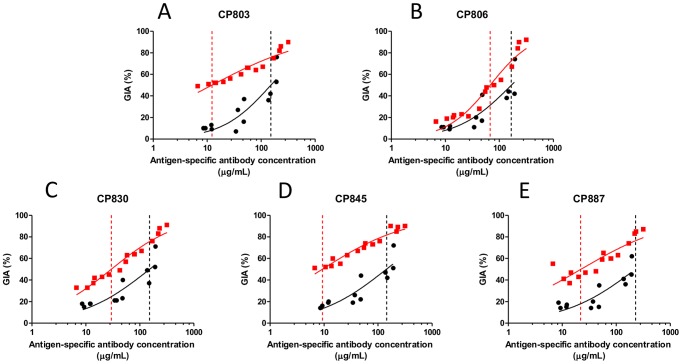
Figure 2. Antigen-specific EC50 estimation for anti-PfRH5 and anti-PfAMA1 IgG against short-term-adapted Cambodian parasite isolates.
Dose-response curves were fitted to all GIA versus antigen-specific antibody concentration data for A) CP803, B) CP806, C) CP830, D) CP845 and E) CP887 (multiple IgG dilutions for each of five rabbits for PfRH5 and each of four rabbits for PfAMA1). Dashed vertical lines indicate the fitted EC50 value for anti-PfRH5 IgG (red) or anti-PfAMA1 (black) IgG for that isolate. Each value is the mean of three wells in a single experiment. Red indicates anti-PfRH5 samples; black indicates anti-PfAMA1 samples.

