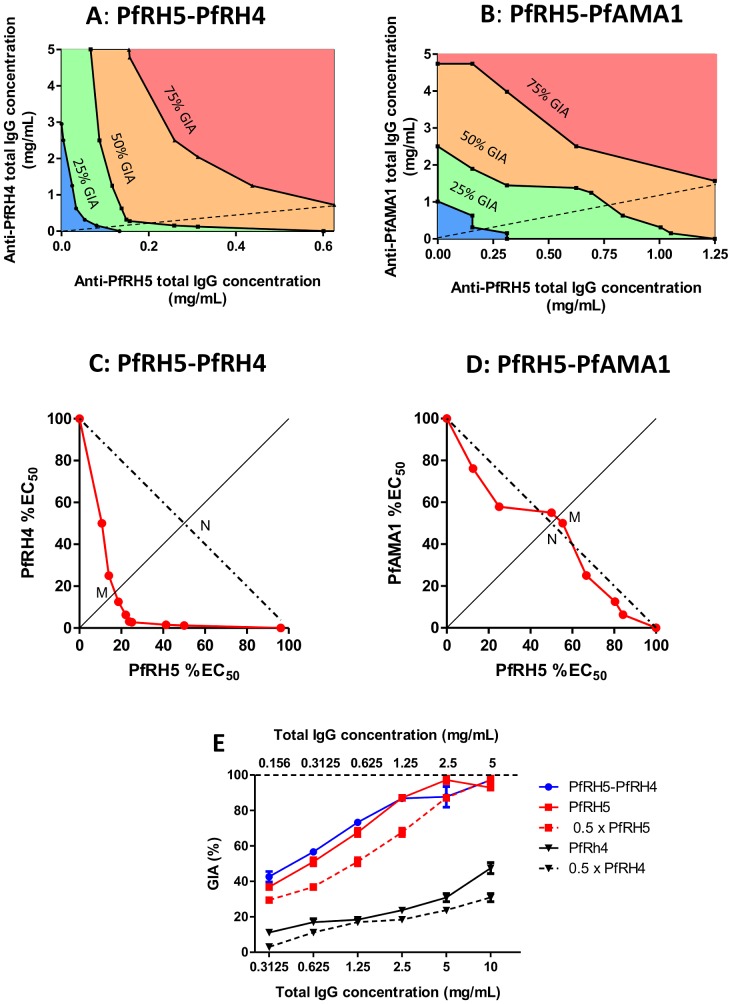
Figure 4. Contour plots and isobolograms of GIA achieved by anti-PfRH5 IgG in combination with either anti-PfRH4 or anti-PfAMA1 IgG.
Panel A,B–Contour plots of GIA versus concentration of total IgG combined from rabbits immunized with either PfRH5 or PfRH4 (A), or with either PfRH5 or PfAMA1 (B). Each experiment was conducted independently. Black lines are contours linking anti-PfRH5 and anti-PfRH4 IgG combinations inducing 25%, 50% and 75% GIA (as labelled), obtained by interpolation between observed GIA values. Shaded area indicates 0–25% GIA (blue), 25–50% GIA (green), 50–75% GIA (orange), and 75–100% GIA (pink). Thin diagonal dashed line from origin indicates line of equal concentration of IgG from each component. Panel C,D – 50% GIA isobologram for anti-PfRH5 and anti-PfRH4 IgG (C) and anti-PfRH5 and anti-PfAMA1 IgG (D) combinations. Red line links the observed combination of anti-PfRH5 IgG and either anti-PfRH4 or anti-PfAMA1 IgG that induced 50% GIA, plotted on axes of anti-PfRH5 and anti-PfRH4/anti-PfAMA1 IgG concentration expressed as percentage of the EC50. Dashed line illustrates 50% contour predicted if anti-PfRH5 IgG and the other antibody are Loewe additive. Diagonal x = y line from origin links points at which anti-PfRH5 and anti-PfRH4/PfAMA1 IgG concentrations (as proportion of EC50) are equal; the letters M and N indicate the line intersections used to calculate Hewlett's synergy index. Panel E – GIA attained by mixing equal concentrations of anti-PfRH5 with anti-PfRH4 IgG (blue line), plotted against the total IgG concentration in the well shown on the lower x-axis (i.e. twice the concentration of each individual component). The solid red line indicates the GIA effect when anti-PfRH5 IgG is used alone at the concentrations on the lower x-axis (i.e. twice the concentration of anti-PfRH5 IgG in the antibody mixture), and the dashed red line indicates the GIA effect of anti-PfRH5 IgG alone at the concentration shown on the upper dashed x-axis (i.e. the concentration of anti-PfRH5 IgG present in the antibody mixture). The solid and dashed black lines indicate the same relationship for anti-PfRH4 IgG.

