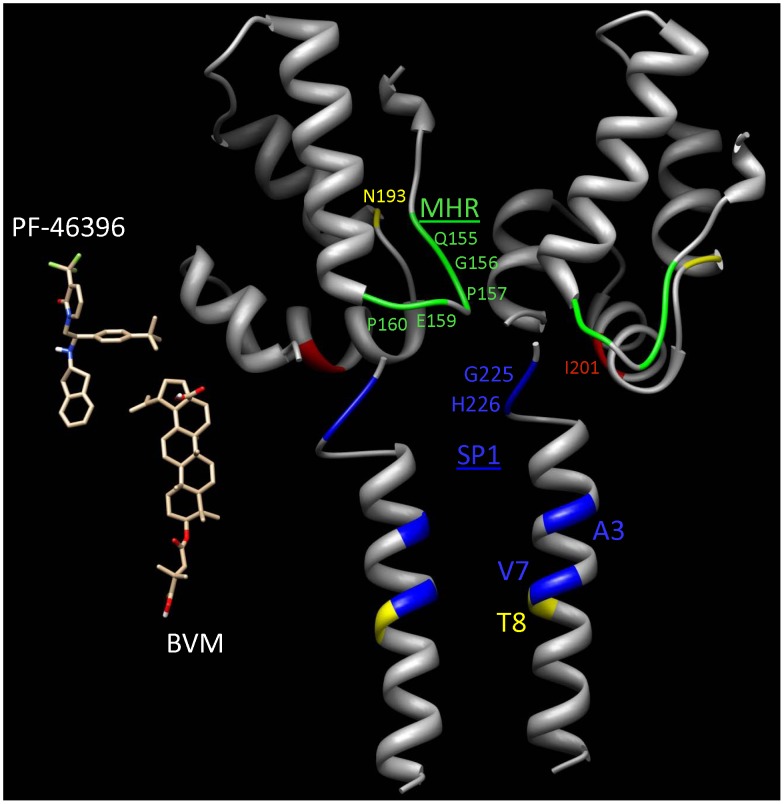
Figure 13. Schematic molecular model of PF-46396 and BVM binding sites.
The ribbon diagrams illustrate two adjacent CA-CTD/SP1 monomers in the hexagonal complex of the immature capsid. The atomic coordinates of the CA-CTD and SP1 domains were obtained from PDB 3H4E [66] and PDB 1U57 [27], respectively. Residues 220–223 that link the CA-CTD and SP1 domains of each monomer were not modeled due to a lack of experimental data. The relative orientations of the adjacent CA-CTD domains were taken from the models of Bharat et al. [61]. The sites of resistance mutations are labeled and color-coded for location: Green, blue and red for the MHR, CA-CTD/SP1 boundary, and individual I201 residue, respectively. Yellow indicates the sites of secondary substitutions that rescue the G156E and P157S mutants. Also shown are stick figures of the PF-46396 and BVM compounds at the heights of their respective binding sites predicted from the locations of the resistance mutations (color-code: C – brown, N - blue, O - red, H – white, and Fl – green). The rotational orientation of PF-46396 is arbitrary, but that of BVM is taken from the photoafinity data of Nguyen et al. [45]. The proximity of the MHR of the left monomer to the CA-CTD/SP1 region of the right one suggests that the binding sites of the two compounds straddle adjacent monomers. This would explain the observed necessity of Gag assembly into the immature capsid structure for BVM cleavage inhibition (see text).

