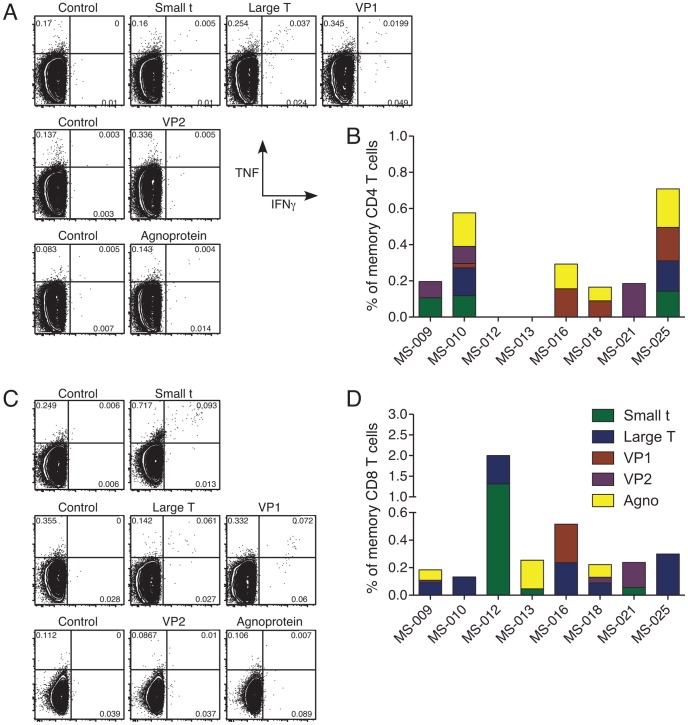
Figure 1. T cell responses to JC virus target each viral protein.
PBMC from individuals with MS treated with natalalizumab who did not have PML were stimulated with JCV peptide pools or costimulatory molecules alone (negative control) for 6 hours. Panel A shows memory CD4 T cells from 3 samples; Panel C shows memory CD8 T cells from 3 samples. The fluorescence intensity of IFNγ and TNF are shown on the X and Y-axes, respectively. Panels B and D show baseline pre-treatment responses from all eight longitudinal subjects with MS, with the background-subtracted magnitude of the response to each JCV protein depicted by colored bars. Responses were measured by production of any combination of IFNγ, TNF and IL-2, using Boolean gates and then background subtracting from each Boolean population.

