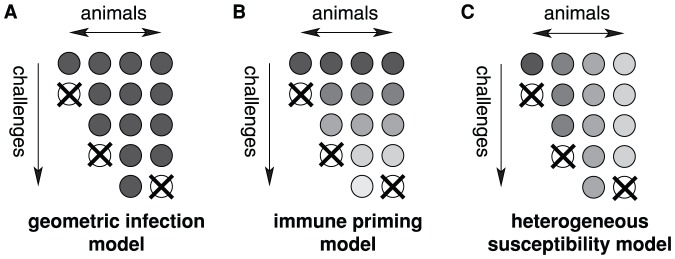
Figure 2. Diagrammatic representation of the infection models.
A the geometric infection model, B the immune priming model, and C the heterogeneous susceptibility model. The circles represent animals, and the darkness corresponds to their susceptibility. Crossed circles signify that an animal has become infected. The geometric infection model assumes equal susceptibilities across animals and challenge repeats. In the immune priming model, the susceptibilities decrease with each challenge received, but animals that received the same number of challenges have the same susceptibility (illustrated by the same level of grey along the animal axis). In the heterogeneous susceptibility model, the susceptibility is assumed to vary across animals, but not with challenge repeats (illustrated by the same level of grey along the challenge axis).

