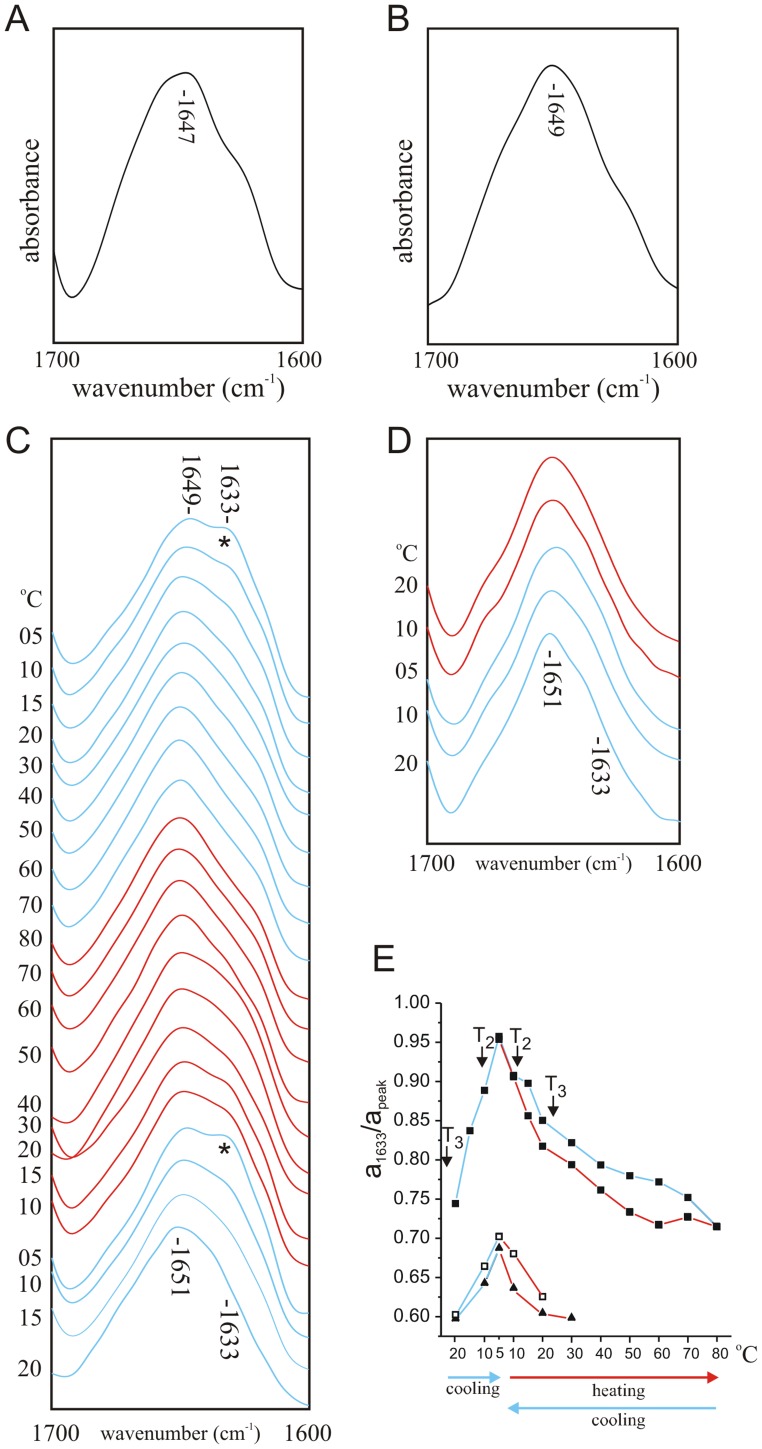
Figure 3. KV1-ID interaction monitored by FTIR.
A. FTIR spectrum of wild-type ID peptide (10 mg/ml) at 5°C in deuterated PBS with 40% v/v TFE, 100 mg/ml DMPC. B. FTIR spectrum of V7E ID peptide (10 mg/ml) at 5°C in deuterated PBS with 40% v/v TFE, 100 mg/ml DMPC. C. Amide I regions of deconvolved spectra of KV1 polypeptide (10 mg/ml) reconstituted by thin-film method into DMPC vesicles (100 mg/ml) in the presence of 1 mg/ml wild-type ID peptide in deuterated PBS with 40% v/v TFE at a range of temperatures during cooling from 20°C to 5°C (blue lines), heating from 5°C to 80°C (red lines) and re-cooling from 80°C to 5°C (blue lines). The initial 1651 cm−1 absorbance peak and the emerging 1633 cm−1 peak (*) are indicated. D. Amide I regions of deconvolved spectra of KV1 polypeptide (10 mg/ml) reconstituted by thin-film method into DMPC vesicles (100 mg/ml) in the presence of 1 mg/ml V7E ID peptide in deuterated PBS with 40% v/v TFE at a range of temperatures during cooling from 20°C to 5°C (blue lines) and heating from 5°C to 30°C (red lines). The initial 1651 cm−1 absorbance peak and the 1633 cm−1 wavenumber are indicated. E. Comparison of absorbance of infrared light at 1633 cm−1 relative to absorbance at 1652 cm−1, calculated from deconvoluted spectra, of KV1 polypeptide reconstituted in DMPC vesicles at a range of temperatures during cooling from 20°C to 5°C (blue lines), heating from 5°C to 80°C (red lines) and re-cooling from 80°C to 5°C (blue lines); peaks from KV1+ wild-type ID peptide (filled squares) are compared with those from KV1+ V7E ID spectra (open squares) and from KV1 in the absence of ID peptide (filled triangles). Previously reported DMPC phase transition points T2 and T3 are denoted next to their respective temperatures.

