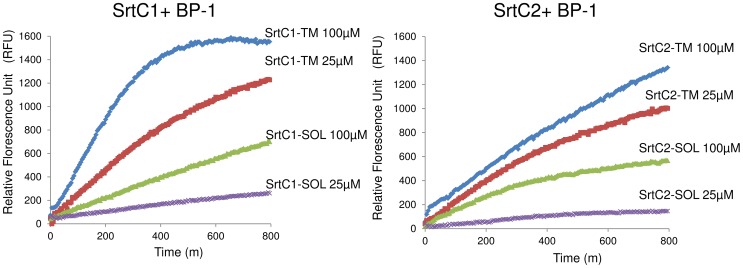
Figure 3. Enzymatic activity of SrtC1 and SrtC2 with or without the C-terminal transmembrane (TM) region.
FRET assay of sortase enzymes SrtC142–263 (SrtC1-SOL) and SrtC242–256 (SrtC2-SOL), lacking the leader sequence, the N-terminal and C-terminal hydrophobic regions, in comparison with SrtC142–305 (SrtC1-TM) and SrtC242–283 (SrtC2-TM), preserving the C-terminal TM region and lacking the leader sequence and the predicted N-terminal hydrophobic region using the fluorescent peptide BP-1 (128 µM) containing an LPXTG motif as a substrate. Each recombinant enzyme was analyzed at 25 µM and 100 µM and the fluorescence emission was monitored every 5 minutes. The higher values in fluorescence intensity were observed with SrtC1-TM and SrtC2-TM.

