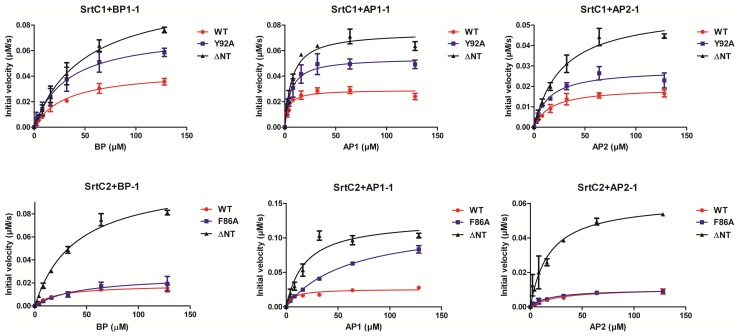
Figure 6. Kinetic analysis of PI-1 SrtC1 and SrtC2 wild-type and mutants.
Triplicate data sets for each experiment were used to calculate the steady-state velocity at different PI-1 peptides concentrations for each enzyme and were expressed as initial rates (µM/s) versus concentration of substrate. SrtC1 (top) and SrtC2 (bottom) enzymes carrying the mutation Y92A and F86A (SrtC1Y92A and SrtC2F86A) and the deletion of the entire N-terminal region (SrtC1ΔNT and SrtC2ΔNT) were analyzed in comparison with wild-type enzymes by FRET assays at various concentrations of three different PI-1 peptides (Table 2). The reactions containing 25 µM of enzyme and 2–128 µM of fluorescent peptide were performed at 37°C in 20 mM HEPES pH 7.5, 100 mM NaCl and 1 mM DTT.

