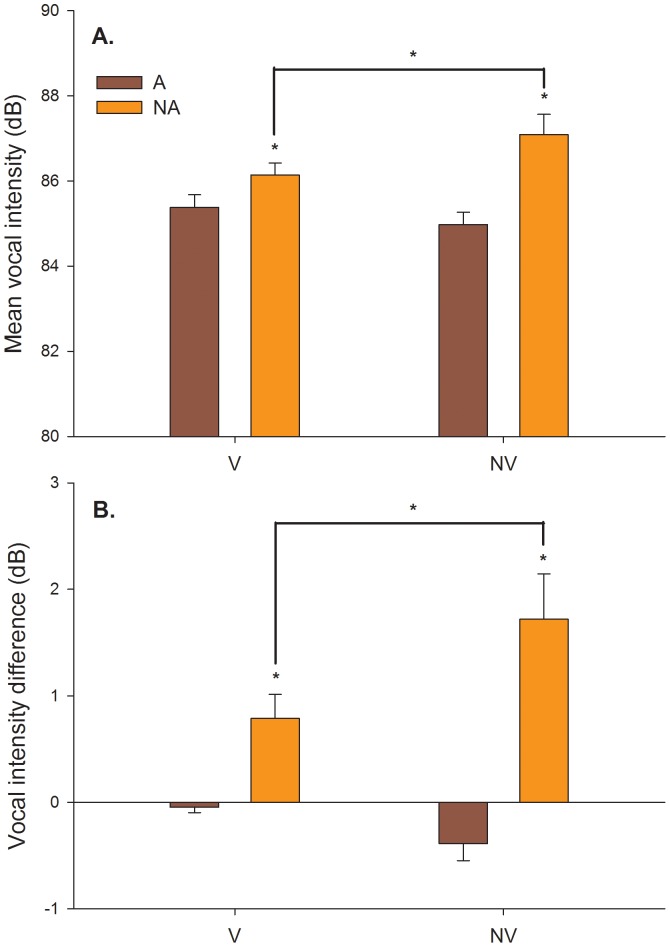
Figure 3. Significant interactions for overall vocal intensity (A) and for the difference in mean vocal intensity over the two trial phases corresponding to the period before feedback removal (t = 2–10 s) and the period following it (t = 11–18 s) (B) among factors of auditory feedback condition and visual feedback condition.
In all cases, asterisks and connecting lines represent reliable pairwise comparisons, significant at p<.01. Error bars represent standard error.

