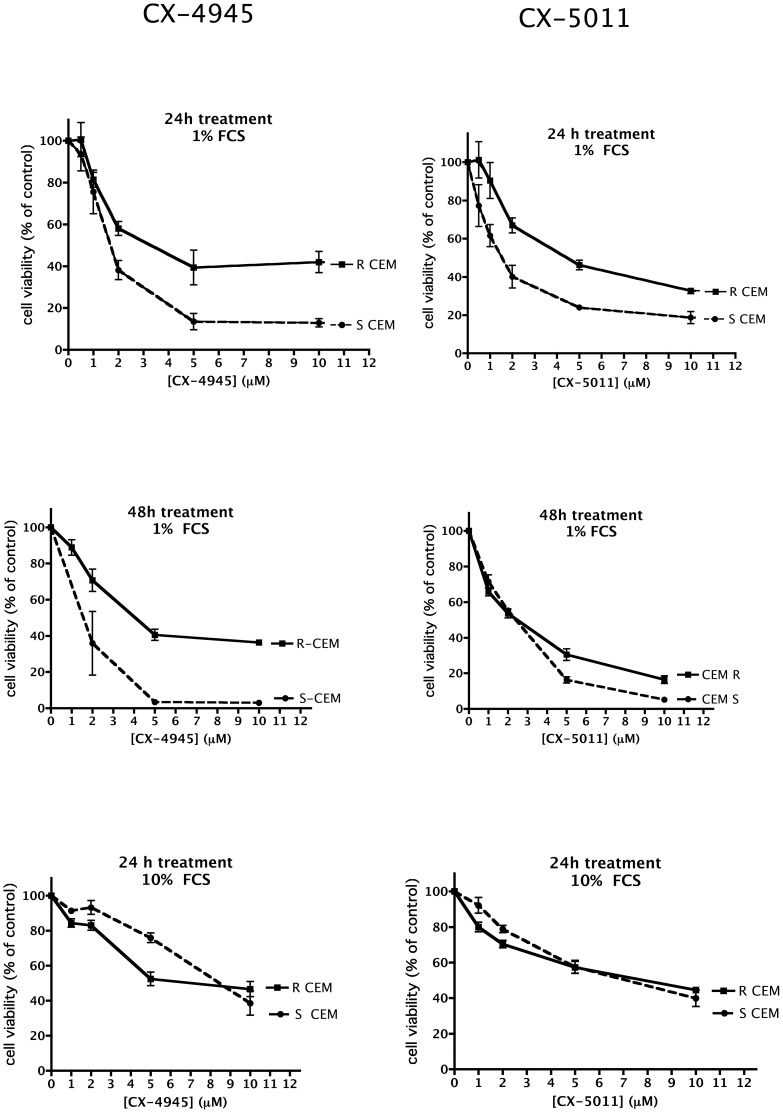
Figure 5. Cell viability of CX-4945 and CX-5011 treated CEM cells.
Cells were incubated with increasing concentrations of the CX compounds; the FCS concentration in the medium and the treatment time are indicated on each graph. Cell viability was assessed by the MTT method, assigning 100% value to the vehicle-treated control cells. Mean ± SE values of at least four independent experiments are reported.

