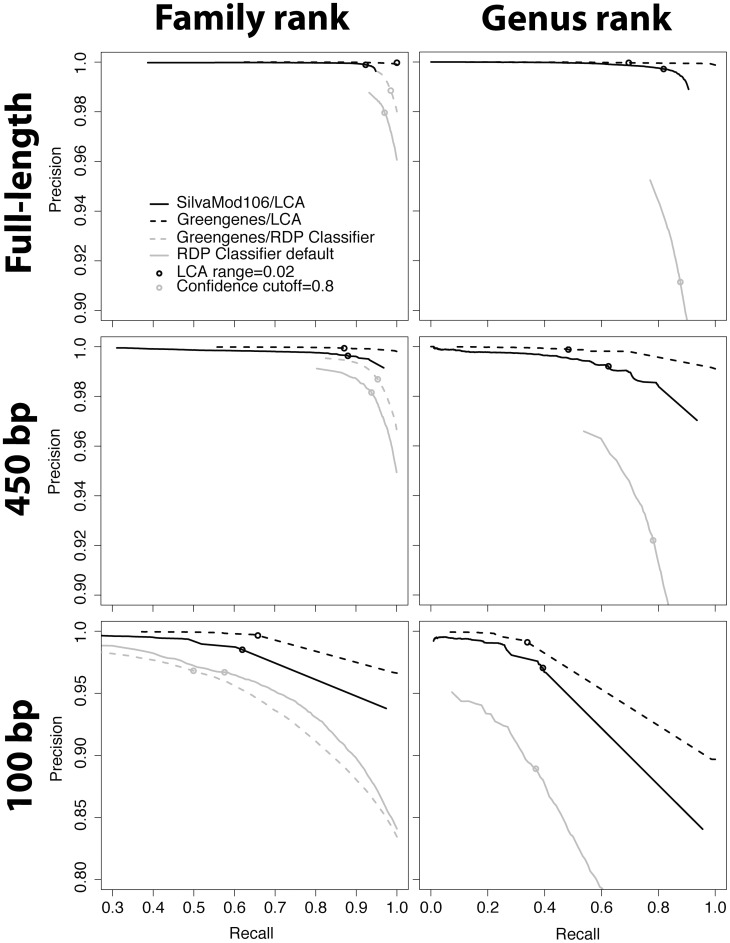
Figure 2. Precision-recall curves from ten-fold cross validation.
Shows the precision (number of correct assignments/number of assignments made) on the y-axis and measured recall (sensitivity or true positive rate) on the x-axis, when varying LCA range or confidence cutoff. Circles indicate the default cutoffs (cutoff for RDP = 0.8, LCA range = 00.2).

