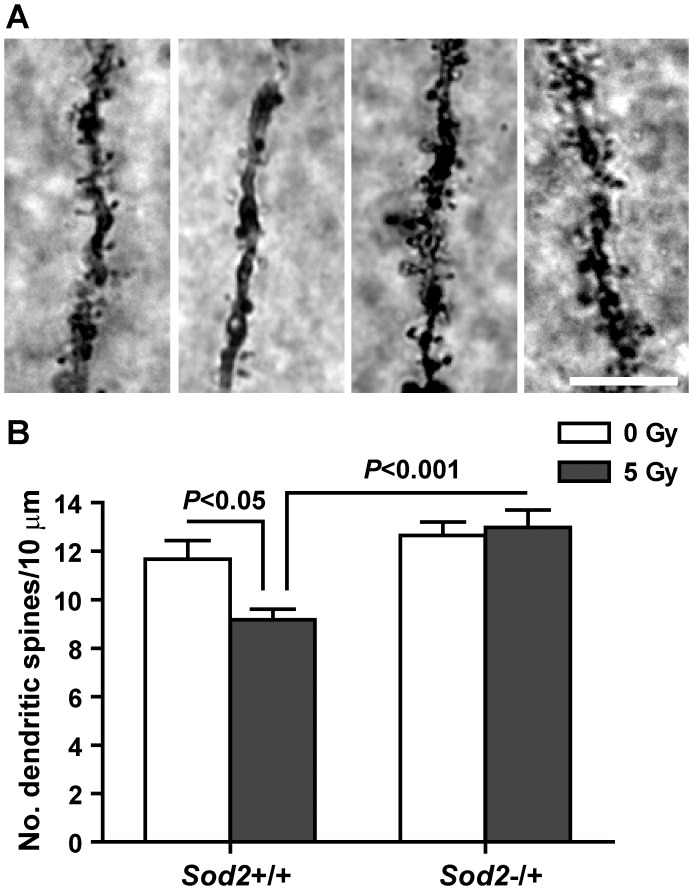
Figure 4. Dendritic spine density following behavioral studies.
The number of dendritic spines was analyzed in secondary and tertiary dendrites of granule cells in the dentate gyrus after behavioral studies. Upper panel, representative photos from (left to right) Sod2+/+/0 Gy, Sod2+/+/5 Gy, Sod2−/+/0 Gy, and Sod2−/+/5 Gy mice. Lower panel, average spine densities. Sample size: n = 4, 6, 5, and 4 for Sod2+/+/0 Gy, Sod2+/+/5 Gy, Sod2−/+/0 Gy, and Sod2−/+/5 Gy, respectively. Only genotype (F (1,15) = 15.59, p = 0.0013) contributed significantly to the data variations, and there was a significant interaction between genotype and treatment (F (1,15) = 5.46, p = 0.0337). P values indicate Bonferroni post test results. Data are presented as mean ± SEM. Scale bar = 10 µm.

