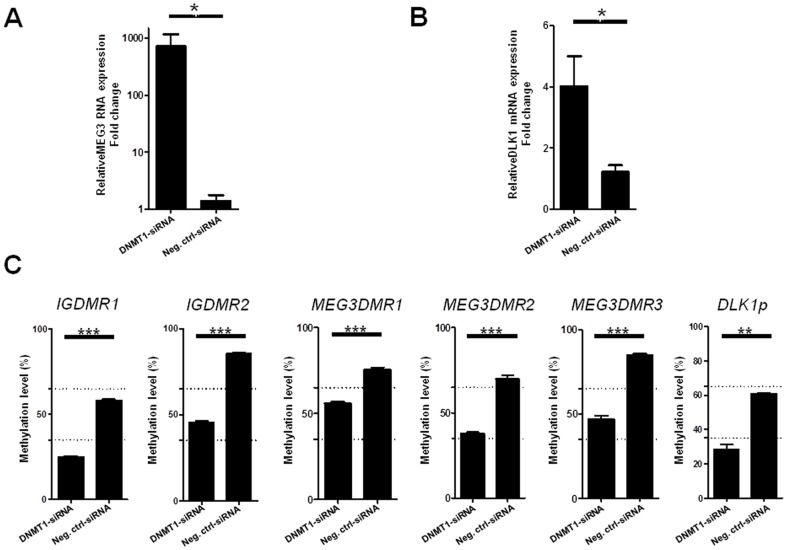
Figure 4. Restoration of MEG3-RNA and DLK1 mRNA expression after DNMT1 knock down and reduction of methylation at MEG3 imprinting loci.
(A) Quantitative MEG3 RNA and (B) DLK1 mRNA expression levels in HLE cells after DNMT1 knockdown after normalization to GUSB and GAPDH levels (p = 0.029). (C) Reduction of DNA methylation at DLK1/MEG3 imprinting locus after DNMT1 knock down (DLK1p: DLK1 promoter). Methylation analysis was performed using quantitative pyrosequencing. Paired t-test showed significant decrease of methylation after DNMT1 knockdown for all six regions. Values shown for qRT-PCR and DNA methylation analysis are means from two independent DNMT1-knockdown experiments (50 nM and 100 nM) and two different negative control siRNAs. * = 0.001<p<0.05, *** = p<0.0001.

