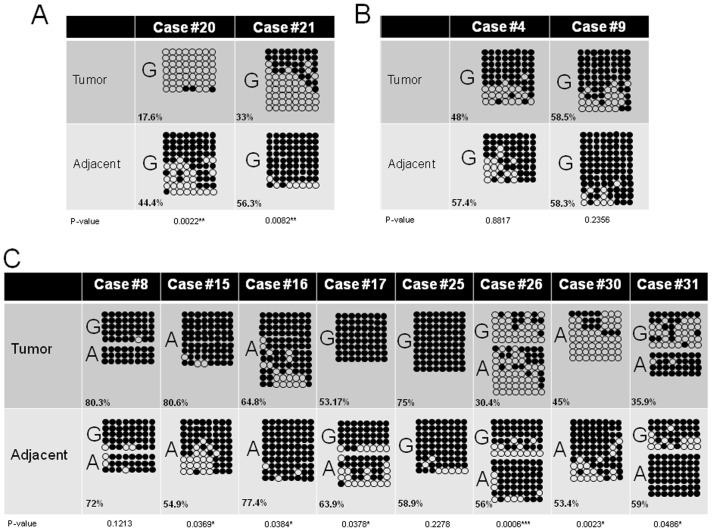
Figure 7. DNA methylation analysis of the IG-DMR1 of the DLK1-MEG3 locus in human HCC.
A) Gain of bi-allelic expression is accompanied by substantial loss of methylation. B) Tumour samples displaying retention of the original imprinting pattern by strict mono-allelic expression of the same allele as in the adjacent non-cancerous liver tissue show only minor variations in DNA methylation. C) Tumour samples demonstrating allelic switching (i.e., mono-allelic expression from the normally silenced imprinted allele) show variable changes of DNA methylation patterns to an intermediate degree. The numbers in the lower left corner of each bisulfite sequencing panel are the methylation values for the region according to pyrosequencing. “G” and “A” denote the sequence at SNP Rs12437020, which allows in heterozygous samples the differentiation of the two alleles. For the calculation of the statistical significance of the changes in DNA methylation the methylation level for each clone was calculated by computing the fraction of methylated CpG sites. From these values a mean methylation level of the tumor and adjacent liver tissue sample, respectively, was calculated. These two mean values were compared using Mann-Whitney-U-test and the p-values are depicted below the schematic representation of the bisulfite sequencing results.

