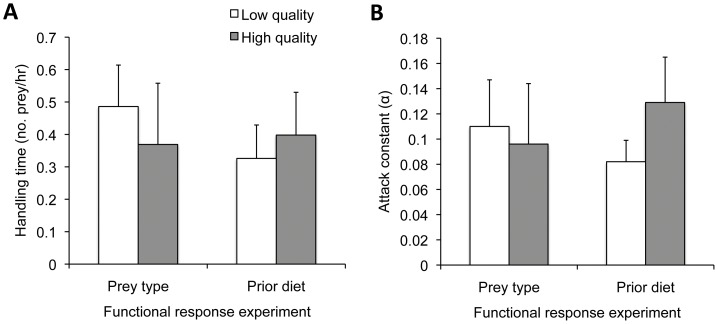
Figure 2.
Estimates of functional response parameters: handling times (A) and attack constants (B). In experiment 1, there were no differences in A: handling time (df = 1,96, t = 0.51, P = 0.61) or B: attack constant (df = 1, 96, t = 0.03, P = 0.82) between spiders foraging on low or high quality prey. In experiment 2, there were no differences in A: handling time (df = 1,98, t = 0.43, P = 0.67) or B: attack constants (df = 1, 98, t = 01.18, P = 0.24) for spiders with contrasting dietary histories. Bars indicate averages with 95% CI. Open bars are used for low quality prey type or diet and shaded bars are used for high quality prey type or prior diet.

