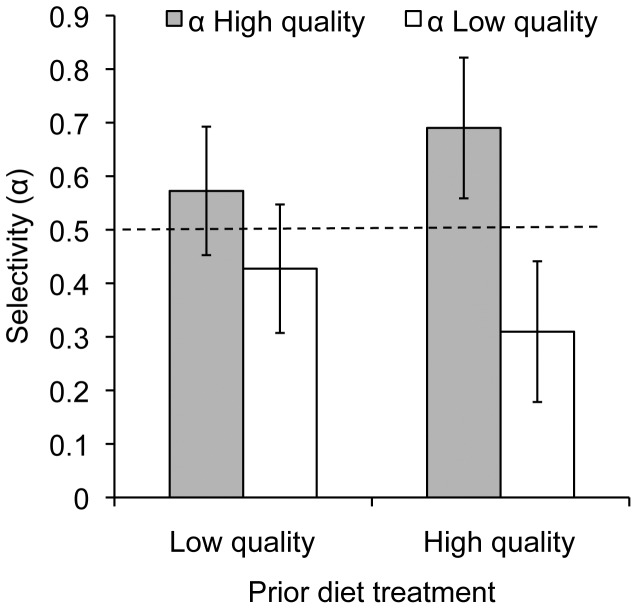
Figure 3. Prey type selected by spiders that were provided either a low or high quality diet.
In experiment 3, the average preference scores (α) (and 95% confidence interval) for spiders that had been on a low quality diet were not significantly different from α = 0.50, which represents random prey selection (dashed horizontal line), whereas spiders on a high quality diet prior to testing showed negative selection for low quality flies (95% CI lies below the line) and positive selection for high quality flies (95% CI is above the line).

