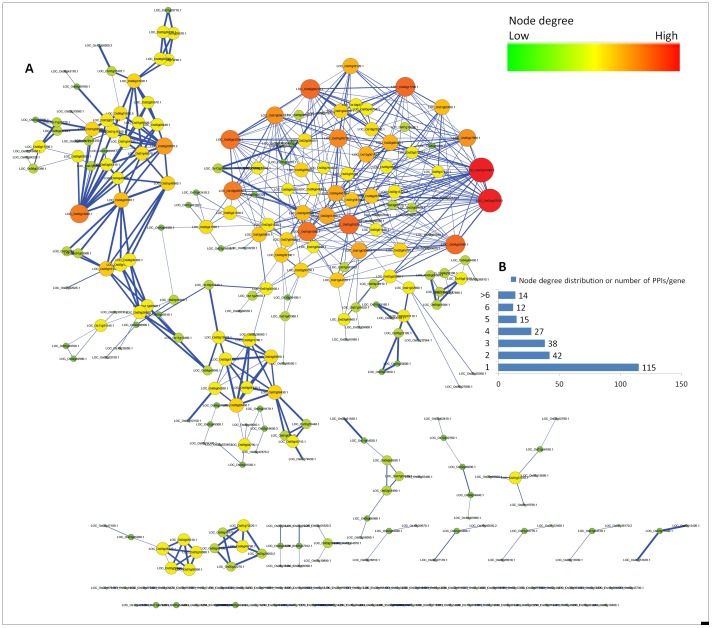
Figure 6. Protein-protein interactions (PPIs) network of cluster-EU.
A) Network diagram showing DRGs as circles with size and color corresponding to number of PPIs. The large size of the circle and color intensity indicate higher number of PPIs,. Thickness of edges between two nodes is based on String-DB score. Thicker edges denote high String-DB scores, B) The number of genes with different number of PPIs (X-axis).

