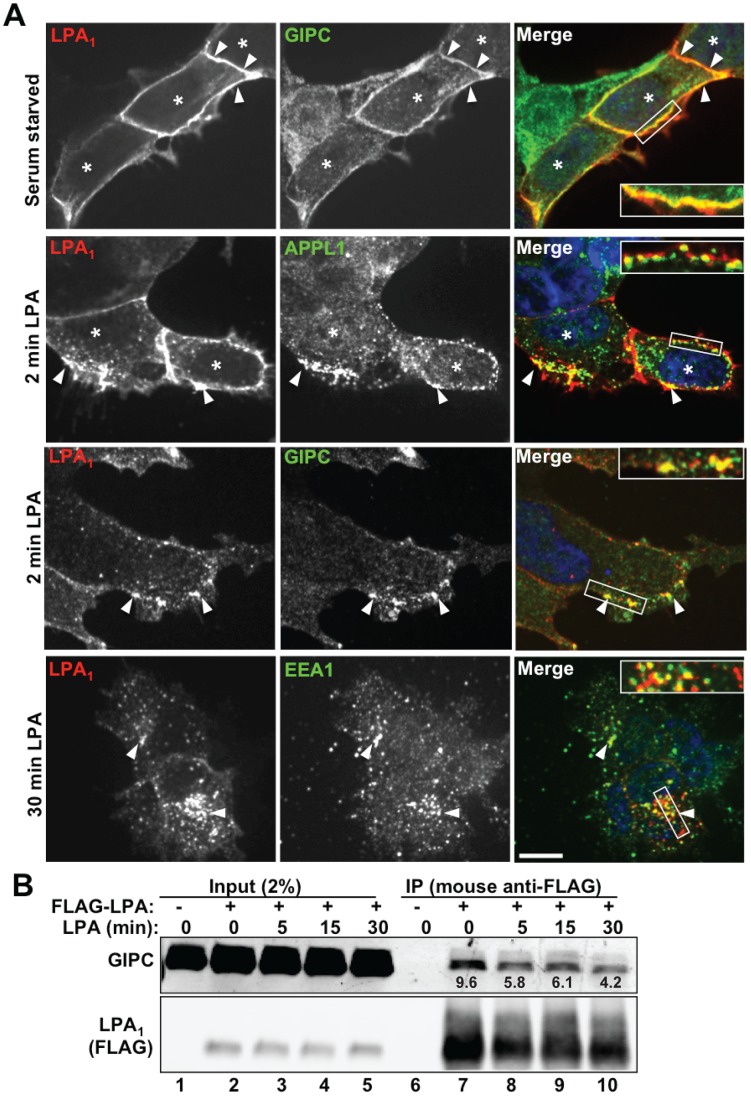
Figure 2. Trafficking of LPA1 and GIPC to Endosomes.
A, Upper panel: In serum starved cells stably expressing LPA1 (asterisks), GIPC is concentrated at the plasma membrane (arrowheads) where it colocalizes with LPA1. Middle panels : 2 min following stimulation with LPA, LPA1 colocalizes with APPL and GIPC (arrowheads) in endocytic vesicles at the cell periphery. Lower panel : 30 min following stimulation, LPA1 colocalizes with EEA1 in early endosomes concentrated in the juxtanuclear region (arrowheads). Boxed regions are enlarged (2.2×) in the insets. Bar = 10 µm. HEK- LPA1 cells were serum starved for 4 h, incubated on ice with mouse anti-FLAG IgG to label FLAG-LPA1 at the cell surface, washed in PBS and shifted to fresh medium containing LPA (10 µM) 2 or 5 min before fixation. Cells were processed for immunofluorescence using affinity purified rabbit anti-GIPC, anti-APPL1 or anti-EEA1 IgG, followed by goat anti-rabbit Alexa-488 and goat-anti-mouse Alexa-594 F(ab’)2 (the latter to detect FLAG-LPA1). Images were taken with a PerkinElmer UltraView Vox Spinning Disk Confocal unit connected to an Olympus IX81 inverted microscope and a EMCCD camera (Hamamatsu) using a 60X oil immersion lens (1.42 NA). B, GIPC co-immunoprecipitates with FLAG-LPA1 from serum-starved cells (lane 7) at all time points after LPA stimulation, but the interaction gradually decreases after LPA stimulation (lanes 8–10). The relative abundance of GIPC that coprecipitated with FLAG-LPA1 is indicated beneath each band. As expected, both LPA1 and GIPC are absent from immunoprecipitates of cells transiently transfected with empty vector instead of FLAG- LPA1 (lane 6, vector control). HEK293 cells were transiently co-transfected with full-length GIPC and FLAG-LPA1 (lanes 2–5 and 7–10) or GIPC alone (lanes 1 and 6). Cells were serum starved overnight (lanes 1, 2, 6 and 7) or starved and stimulated with 10 µM LPA for 5 (lanes 3 and 8), 15 (lanes 4 and 9) or 30 min (lanes 5 and 10) before lysis. IP was carried out on cell lysates using mouse anti-FLAG IgG and immunoblotted as is Fig. 1A. The abundance of GIPC and LPA1 in each immunoprecipitation reaction was quantified using the LICOR imaging system, and the GIPC abundance relative to LPA1 was calculated for each reaction. Similar results were obtained in 2 additional experiments. Input (lanes 1–5): Lysates (2%) are shown to verify comparable expression levels.

