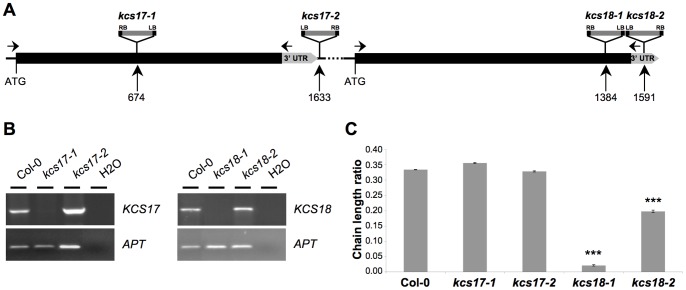
Figure 3. kcs18 insertion mutants show CLR reduction.
A, Structure of the KCS17 and KCS18 genes with positions of the T-DNA insertions in kcs17-1, kcs17-2, kcs18-1 and kcs18-2 mutants indicated. Black boxes represent exons (KCS17 and KCS18 are intronless) and grey boxes represent 3′ UTR regions. Numbers indicate distance in basepairs from the ATG. LB, left border of T-DNA; RB, right border of T-DNA. B, RT-PCR analysis of KCS17 and KCS18 expression in 10-day-old seeds of wild type (Col-0), kcs17-1, kcs17-2, kcs18-1 and kcs18-2 plants. APT (ADENINE PHOSPHORIBOSYLTRANSFERASE) was used as a constitutively expressed gene control. Primers used for RT-PCR are indicated by arrows in A. For each genotype, 15 siliques (5 siliques harvested from 3 different plants) have been dissected. C, CLR from wild type (Col-0) and the indicated kcs mutants. kcs18 mutants display a lower CLR compared to Col-0 whereas kcs17 mutants display a similar CLR to Col-0. CLR was measured in triplicate on 100 seeds from a pool of 4 independent plants for each genotype. Bars represent SE values (n = 3). Significance in t-test, ***p<10−5.

