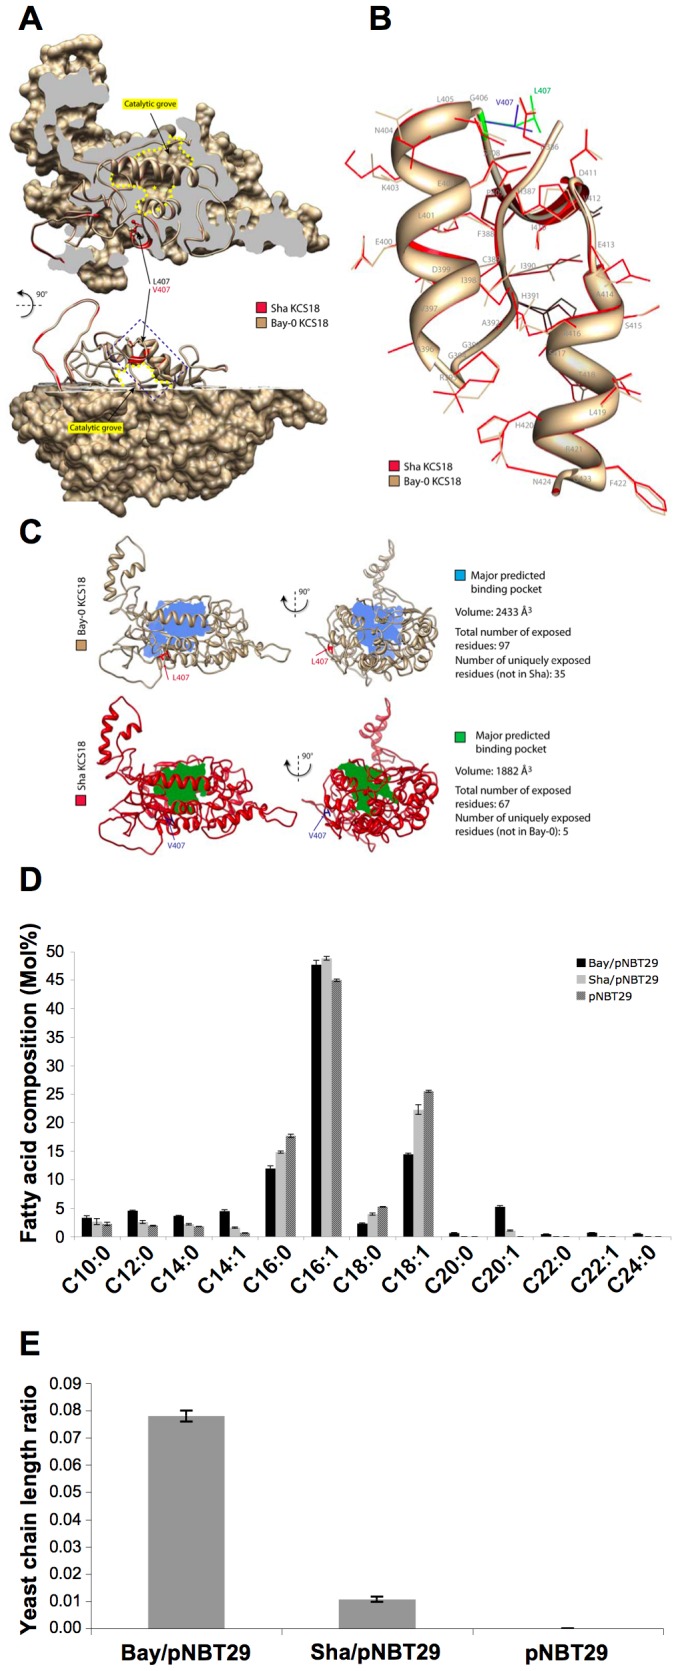
Figure 6. A single amino acid change modulates KCS18 activity.

A, General view of Bay and Sha KCS18 protein models superimposition. Sha KCS18 is shown in red as a ribbon model, Bay KCS18 is shown in tan as a ribbon and surface model. Bay KCS18 model surface is clipped to reveal the position of the predicted catalytic grove, circled in yellow, and the position of the region harboring conformational changes. In both models, the side chain of the variable residue (407) is shown. The dotted blue box delimits the region highlighted in B. B, A close view of the region harboring conformational changes between Sha (red) and Bay (tan) KCS18 models. The models are depicted as ribbons with residue side chain backbones shown. Residue 407 is shown in blue (Sha model) and green (Bay model). C, Analysis of predicted binding pockets in Sha and Bay KCS18 models. Models are shown as ribbons in tan (Bay) and red (Sha), with residue 407 highlighted. The major binding pocket predicted by PocketFinder is shown as a filled volume in blue (Bay) and green (Sha). D, Fatty acid composition of yeast cells transformed with an empty vector (pNBT29), or a vector harboring the Bay (Bay/pNBT29) or Sha (Sha/pNBT29) KCS18 coding sequence. Values are a mean of 6 samples (3 replicates, 2 independent transformations). Bars represent SE. E, Yeast chain length ratio (the sum of all 20- 22- and 24-carbon fatty acids divided by the sum of all 10- to 18-carbon fatty acids) was measured on yeast cells expressing Bay (Bay/pNBT29), Sha (Sha/pNBT29) or no KCS18 protein (pNBT29).
