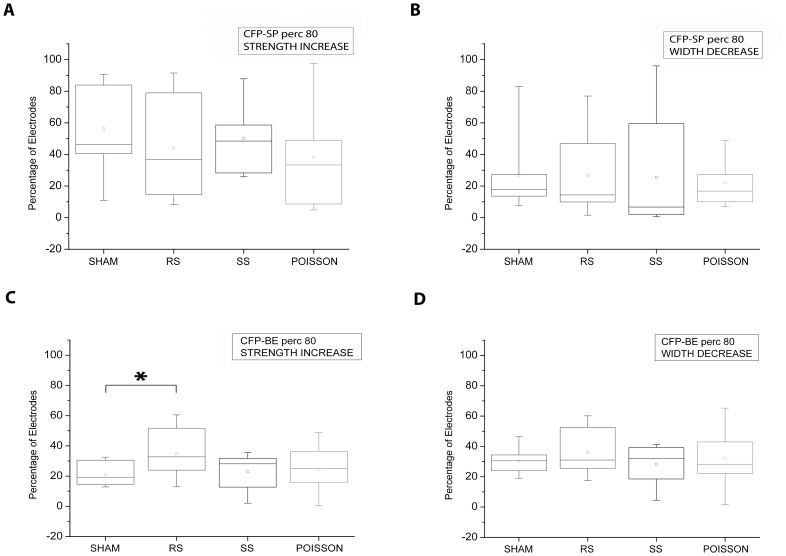
Figure 4. Stimulus-induced modification in the network CFP based on spike and burst events.
A, B) Box plots of the percentage of electrode pairs showing a directional variation of spike train CFP (CFP-ST) strength (A) and width (B) in the post stimulus stage. C, D) Percentage of electrodes pairs showing a directional variation of burst event CFP (CFP-BE) strength (C) and width (D) in the post stimulus stage. *, p<0.05; t test.

