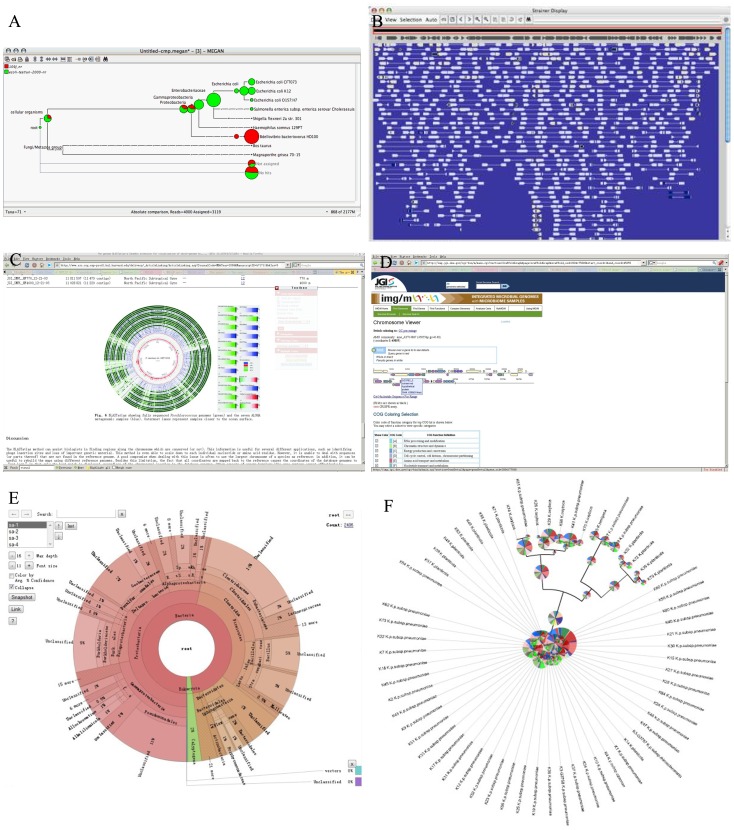
Figure 1. Screenshot of current metagenomic visualization effects.
(A) The visualization result of MEGAN with taxonomy components of two metagenomic samples. (B) The visualization user interface of Strainer (The visualization of components of metagenomics in micro-perspective). The comparison between a component of a metagenome sample and a genome. (C) The visualization user interface of BLASTatla (The visualization of components of metagenomics in macro-perspective: The comparison among a component of metagenome and multiple genomes). (D) Contig and gene annotation visualization of IMG/M. (E) The visualization user interface of Krona. This is the user interface of comparison of four saliva microbiomes. (F) The metagenome visualization result of iTOL with default parameters.

