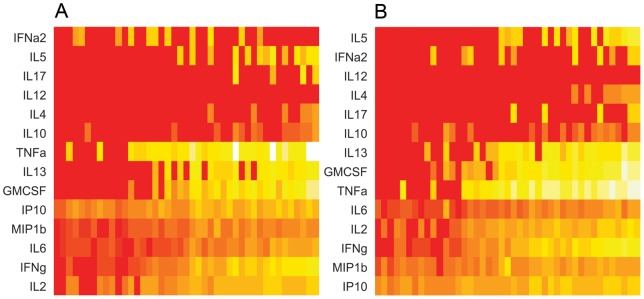
Figure 3. Heat maps: Cytokine levels in verified active TB patients divided by cut-off levels, after stimulation with CFP-10 (3 A) and ESAT-6 (3 B).
The individual values are represented as colours. Light colours indicate high levels of cytokines and vice versa. On the Y-axis: The different cytokines tested with the FASCIA. On the X-axis: The cytokine levels, divided by the cut-off level for each cytokine, logged and sorted by rising proliferative responses (the higher the proliferative response, the further to the right).

