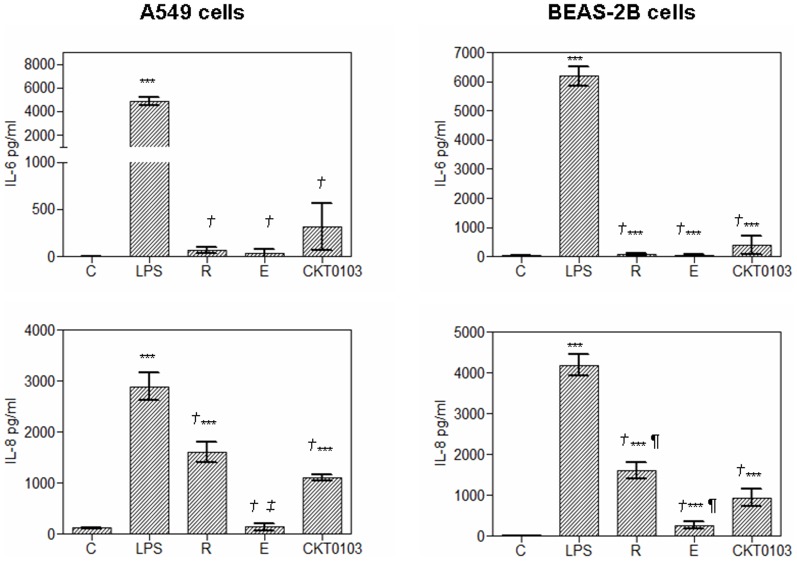
Figure 4. Pro-inflammatory IL-6 and IL-8 production by A549 and BEAS-2B cells as determined by CBA and flow cytometry analysis of culture supernatant after 18 hours of 100 ng/mL E. coli LPS stimulation either alone or in combination with 10 µM rhein, emodin and CKT0103.
***p<0.001 vs. control-vehicle (C); † p<0.001 vs. LPS; ¶ p<0.05 vs. LPS+ CKT0103; ‡ p<0.001 vs. LPS+CKT0103.

