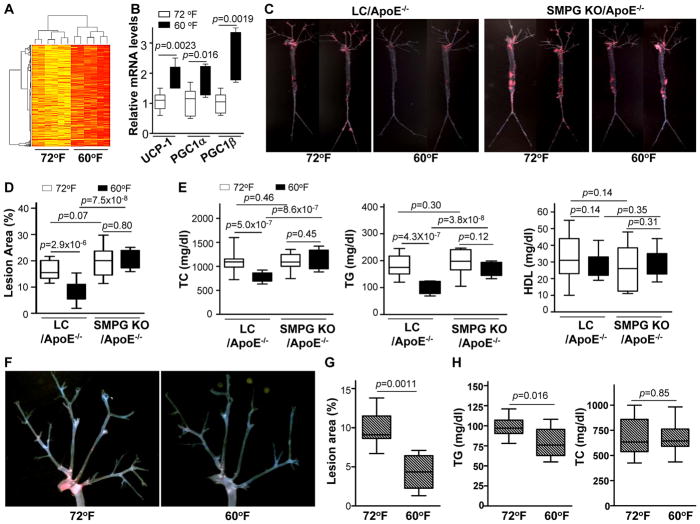
Figure 4.
PVAT activation by housing mice at 60°F reduces atherosclerosis. (A) Hierarchical cluster analysis (HCA) for proteomic clusters in the PVAT of ApoE−/− mice housed at 60°F or 72°F for 2 months. Red color clusters represent enriched proteins compared to yellow clusters. n=6. (B) Real-time PCR mRNA expression levels of UCP-1, PGC-1α, and PGC-1β in PVAT isolated from 8-weeks-old ApoE−/− mice fed a HFD and housed at 60°F or 72°F for 2 months. Data shown as box plots (Whiskers: min to max). n=6. (C) Representative images corresponding to en face Oil Red O staining of the atherosclerotic lesion of whole-aortic trees from 8-week old LC/ApoE−/− and SMPG KO/ApoE−/− mice fed for 4 months with HFD housed at either 60°F or 72°F. (D) Quantification of the ratio (%) of atherosclerotic lesion area to total aortic area for each experimental group in C. Data are shown as box plots (Whiskers: min to max). n=10–15. (E) Total plasma cholesterol (TC), triglycerides (TG), and HDL were analyzed in blood samples collected from mice in each experimental group in C. Data are shown as box plots (Whiskers: min to max). n=10–15. (F) Representative images of en face Oil Red O stained aortic arches from HFD-fed ApoE−/− mice housed at 72°F or 60°F for 2 months following surgical removal of BAT. (G) Quantification of the ratio (%) of atherosclerotic lesion area to total aortic arch area for each experimental condition in F. Data are shown as box plots (Whiskers: min to max). n=10. (H) Total plasma TC and TG were analyzed in blood samples collected from each experimental group in F. Data are shown as box plots (Whiskers: min to max). n=10.

