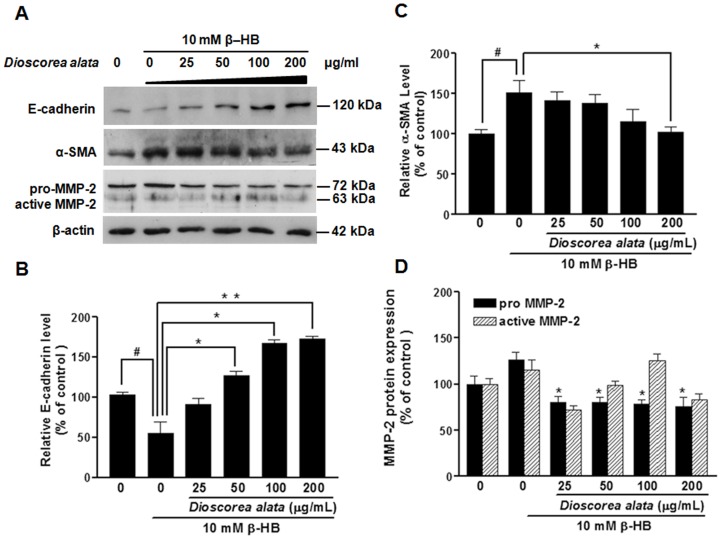
Figure 5. Immunoblot analyses of E-cadherin: α-SMA and MMP-2.
NRK-49F Cells were treated with β-HB (10 mM) in 5% FCS for 48 h, followed by treatment with DA water extract for a further 24 h. For Western blot analysis (A), cell extracts were subjected to SDS-PAGE and immunoblotted with primary antibodies against E-cadherin, a-SMA, and MMP-2. β-actin was the internal control. B–D: Densitometry analysis from A is shown. It is evident that β-HB induced an increase in α-SMA and MMP-2, and caused a decrease in E-cadherin expression; DA reversed the β-HB -induced increase in α-SMA and MMP-2, and also reversed the decrease in E-cadherin expression. The experiment was duplicated with similar results observed. # P<0.05, **P<0.01, *P<0.05.

