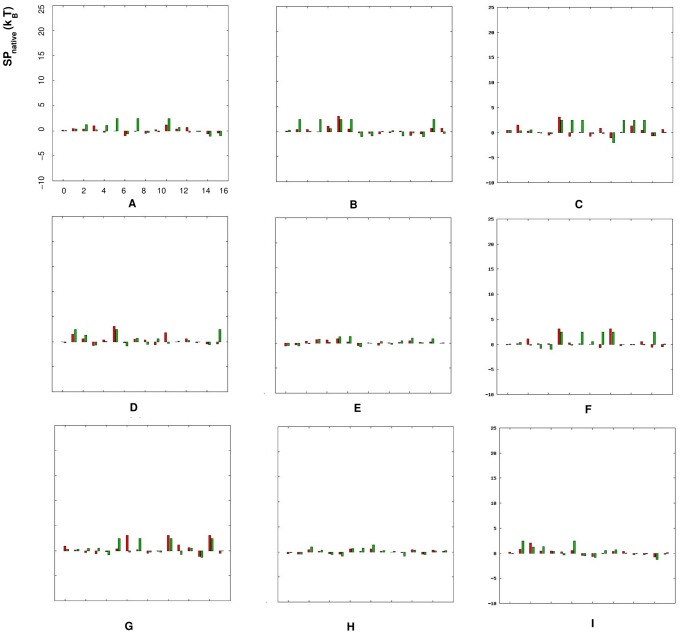
Figure 3. Comparison between the “extracted” statistical potentials  from the RNA09 dataset and the Leontis dataset, respectively.
The figures from (A) to (I) stand for the torsion angles ( ,
,  = ): (A) (
 ,
,  ), (B) (
 ,
,  ), (C) (
 ,
,  ), (D) (
 ,
,  ), (E) (
 ,
,  ), (F) (
 ,
,  ), (G) (
 ,
,  ), (H) (
 ,
,  ) and (I) (
 ,
,  ), respectively. In each figure, the red bars represent the statistical potentials
  extracted from the Leontis dataset, the green bars represent the ones from the RNA09 dataset, and the x-axis stands for the dinucleotides with different nucleotides (
 ,
,  = ) AA, AC, AG, AU, CA, CC, CG, CU, GA, GC, GG, GU, UA, UC, UG and UU from 1 to 16.

