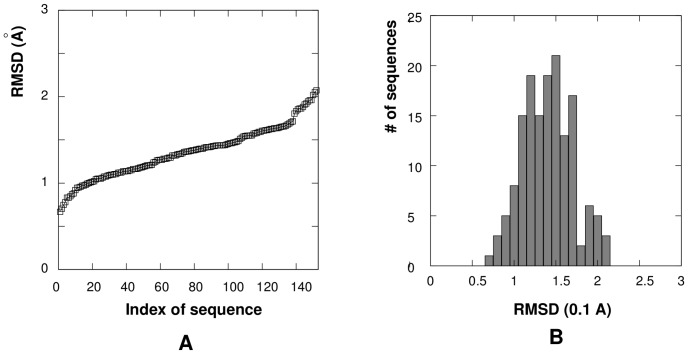
Figure 7. ( ) The RMSD between the PDB structures and the diamond lattice-represented structures for RNA loops and junctions in the RNA09 dataset.
The x-axis represents the index of RNA loops/junctions in the RNA09 dataset. ( ) The number of RNA loops/junctions within each RMSD-value bin (0.1 Å). The mean and standard deviation of RMSD values for the 152 RNA loops/junctions are 1.35 Å and 0.30 Å, respectively.

