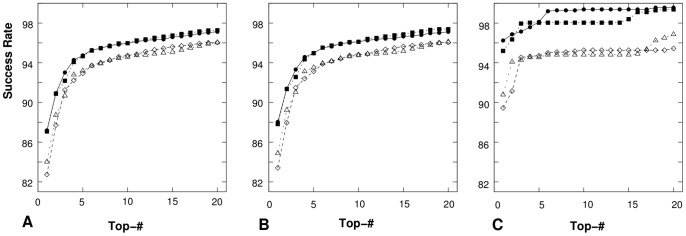
Figure 9. The success rate for the prediction of the coarse-grained correct loop/junction structures for (A) all the 8452 RNA loops and junctions in TEST-I, (B) the 7459 RNA loops and junctions in TEST-II and (C) the 1119 RNA loops and junctions in TEST-III.
The “Top- ” in x-axis means that the “correct” structure is in the top
  lowest-potential conformations. In each figure, “
 ” and “▪” represent the success rate with
  extracted from the Leontis' database and the RNA09 dataset, respectively; while, “
 ” and “◊” represent the success rate with
  extracted from the Leontis' database and the RNA09 dataset, respectively.

