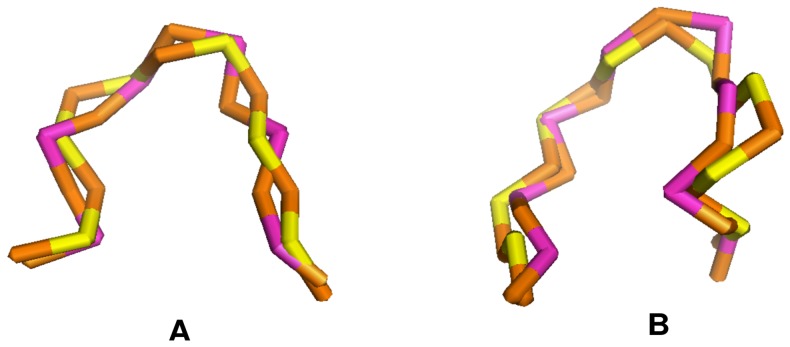
Figure 10. Comparison between the virtual bond-based PDB structure and correctly predicted structure with statistical potentials .
 . The loops are (A) a hairpin loop from PDB structure 1IVS and (B) an internal loop from PDB structure 1JJ2, respectively. In both figures, the structures shown in brown (
 ) and yellow (
 ) stand for the PDB structure, and the ones shown in brown (
 ) and purple (
 ) represent the correctly predicted structure, which have the lowest potential and the minimal RMSD. The RMSD values are (A) 1.52 Å and (B) 1.96 Å, respectively. The atomic structures are illustrated with Pymol software (http://www.pymol.org/).

