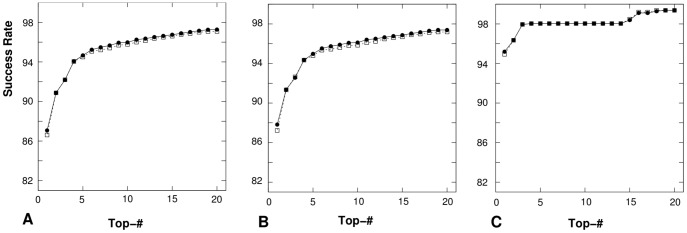
Figure 13. The sensitivity of the structure prediction to the change of the convergence threshold parameter.
:  = 0.001 v.s. 0.01. The tests are based on the predictions of the RNA loops and junctions in all the three databases: (A) TEST-I, (B) TEST-II and (C) TEST-III. In each figure,
  and
and  represent the success rate of the
  -based structure prediction with
  = 0.001 and 0.01, respectively.

