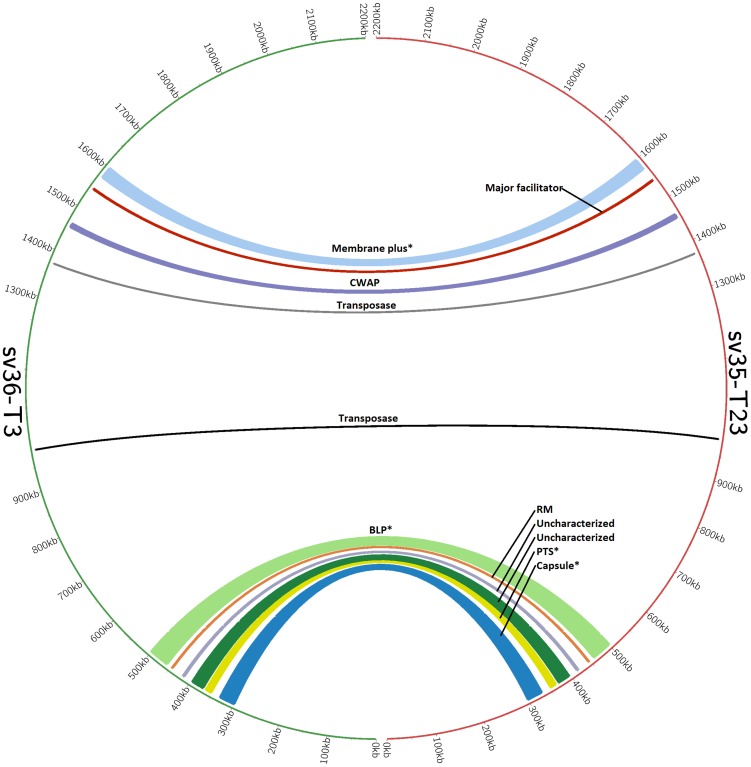
Figure 3. Visualization of neighbor groups between strains SV35-T23 and SV36-T3 using the CIRCOS representation tool.
Each one of the 11 arches represents a neighboring group, the numbering around the circle indicates the position on the chromosome, and the width of the arch correlates to the size of the variant region. ‘*’mark the four regions that contain genic differences in addition to allelic differences. Regions are named relative to a coding sequence of interest, and abbreviations are as follows: restriction modification system (RM), cell wall associated protein (CWAP), phosphotransferase system (PTS), and bacteriocin locus (BLP).

