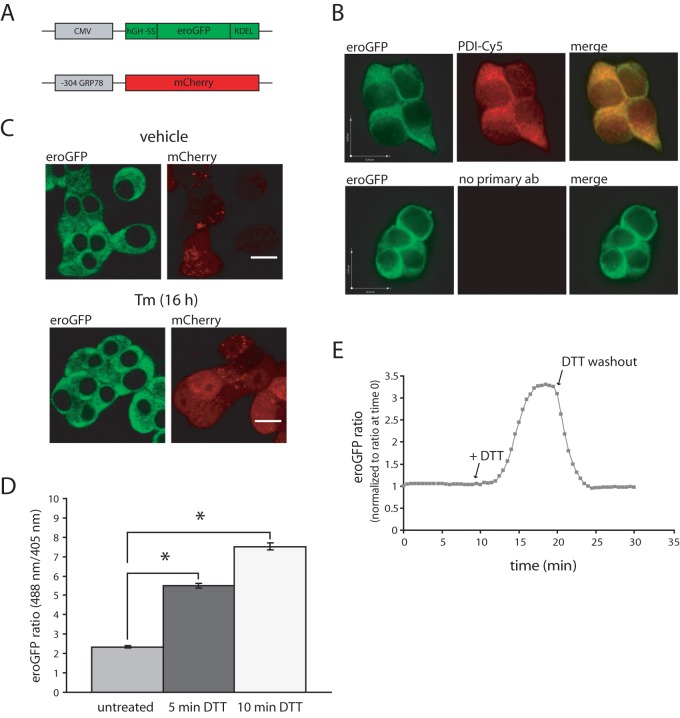
Figure 1. Characterization of eroGFP and mCherry expressing INS-1 (clone # 15/5) cell line.
(A) Schematic diagram of constructs used to generate a double-stable INS-1 insulinoma cell line. (B) Colocalization of eroGFP with PDI by immunofluorescence. Cells were fixed and processed for immunofluorescence by using anti-PDI antibody followed by a secondary antibody labeled with Cy-5. Merging the two images demonstrates colocalization of the signals (yellow in merged image). Images were taken on a spinning disk confocal microscope. (C) Induction of mCherry upon treatment with Tm. Images were acquired on a confocal laser-scanning microscope. Scale bars: 1 µm. (D) Analysis of eroGFP emission from excitation at 488 nm/405 nm in control cells and cells treated with dithiothreitol (DTT, 5 mM) for 5 and 10 min by live cell imaging. eroGFP ratios (defined as the ratio of fluorescence from excitation at 488 nm versus 405 nm) are represented as the mean (±SEM), with a minimum of 50 cells analyzed per condition. * Denotes significance from untreated cells by Student t-test (p<0.05). (E) eroGFP ratio was monitored by confocal microscopy and image analysis. Images were taken every 30 sec. Cells were imaged for 10 min then 5 mM DTT was added. After 10 min DTT containing medium was exchanged for regular medium (DTT washout) and images were taken for another 10 min. The eroGFP ratio was calculated and normalized to the eroGFP ratio at time 0 min. Representative result from two independent experiments is shown.

