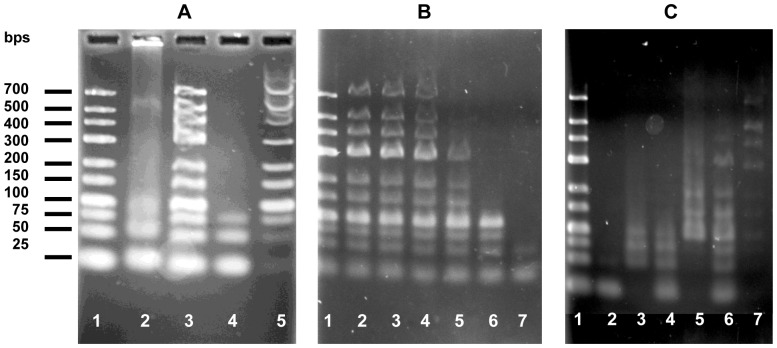
Figure 2. DNA length, concentration, and salt dependencies of crotamine-DNA aggregations, in the standard buffer, unless otherwise indicated.
A. Effect of DNA length. Lane 1: DNA ladder; lane 2∶1 µg (3 nmol in residue) DNA ladder +0.3 nmol crotamine, [crotamine]:[DNA]p = 1∶10; lane 3: same as lane 2, but treated with SDS (0.1% net) prior to electrophoresis; lane 4: supernatant of mixture as in lane 2 after centrifugation at 13,000 rpm for 5 min; lane 5: precipitate of mixture in lane 4 after treatment with 0.1% SDS. B. Effect of relative DNA concentration. Each lane contained 0.5 µg DNA ladder. Samples were centrifuged at 13,000 rpm for 5 min, and supernatants applied to the gel. Lane 1: DNA alone. [crotamine]:[DNA]p = 1∶30 (lane 2), = 1∶20 (lane 3), = 1∶15 (lane 4), = 1∶12 (lane 5), = 1∶10 (lane 6), = 1∶7.5 (lane 7). C. Effect of salt. Each lane contained 1 µg DNA ladder. Lane 1: DNA ladder alone. Lanes 2–7∶0.5 µg DNA ladder +0.3 nmol crotamine in 0.01 M NaCl (lane 2: supernatant, lane 3: SDS-treated precipitate), in 0.05 M NaCl (lane 4: supernatant, lane 5: SDS-treated precipitate), in 0.1 M NaCl (lane 6: supernatant, lane 7: SDS-treated precipitate).

