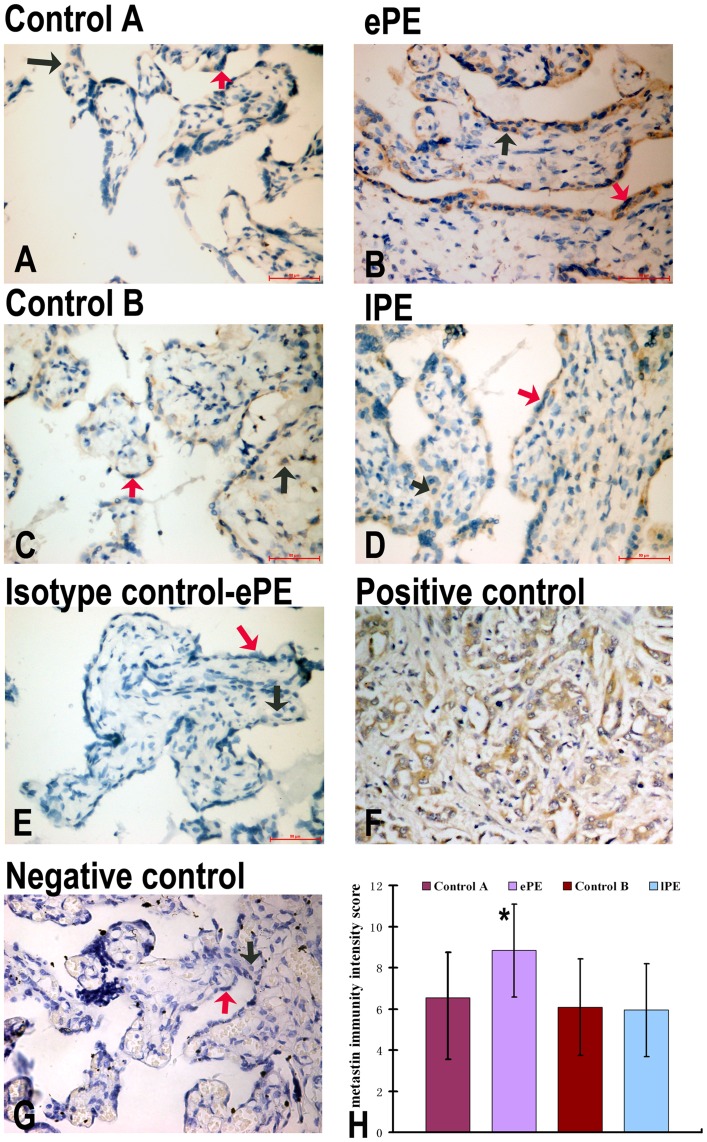
Figure 3. IHC of metastin expression in the placentas of control A (A), ePE (B), control B (C), lPE (D), isotype control (E), positive control (F), and negative control (G).
Panel H shows metastin immunity intensity score semiquantitation. Metastin staining is present in both syncytiotrophoblasts and cytotrophoblasts from Control A, ePE, Control B and lPE (A–D). Trophoblasts from ePE had higher expression of metastin as compared to control A (A, B). lPE had the same intensity expression of metastin as compared with control B (C,D). ePE had significantly higher expression of metastin as compared with control A and lPE (H). Red arrows indicate the syncytiotrophoblast; Black arrows indicate the cytotrophoblast.

