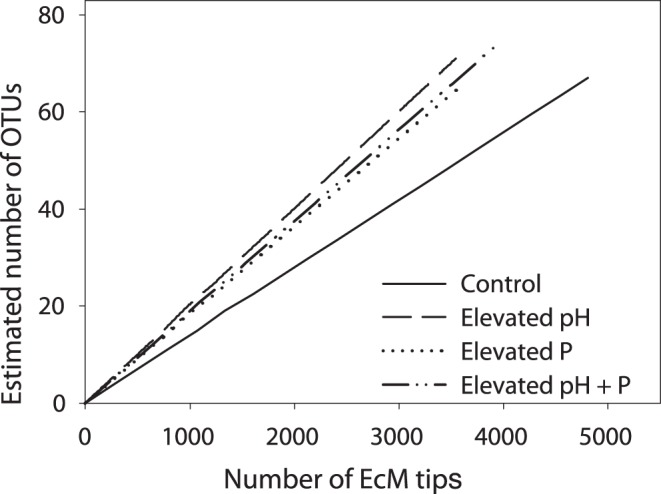
Figure 2. Rarefaction curves showing the expected number of species (97% OTUs) as a function of the number of EcM root tips from each treatment.

Although the control appears to have lower diversity than the treatments, this visual difference is not statistically significant (95% confidence intervals not shown to improve figure clarity).
