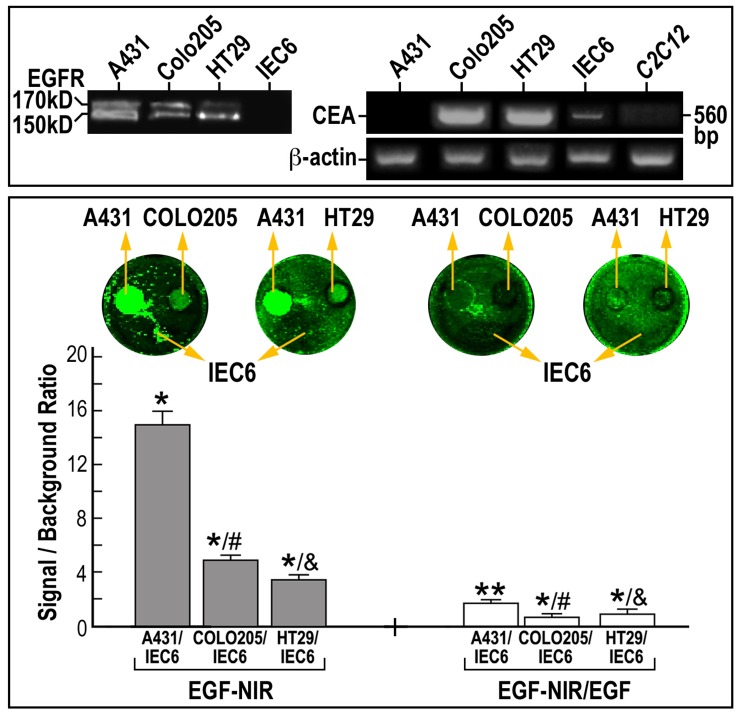
Figure 5. IC-NIR BOI of EGFR levels in CRC clones, in relation to the level of expression of CEA.
Different CRC cells were focally plated on a background of IEC6 enterocyte monolayer. The cultures were incubated for 15 min at 37°C with 7 nM EGF-NIR in the presence (nonspecific binding – white bars) or absence (total binding – grey bars) of 100 nM unmodified EGF. The signal (CRC cell line)/ background (IEC6) ratio was estimated at identical conditions for all cultures and is presented as the mean ± SD (n = 9). Significance: * p<0.05 compared to IEC6 values; ** p<0.05 compared to total binding of the respective group p< 0.05 compared to A431 and & p<0.05 compared to COLO 205; Lower inserts: NIR scans; Upper inserts: left-EGFR protein expression by western blotting; arrow indicate the position of mature EGFR 170 kD protein and non-glycosylated 150 kD protein; right-mRNA expression of CEA and β-actin in cell cultures.

