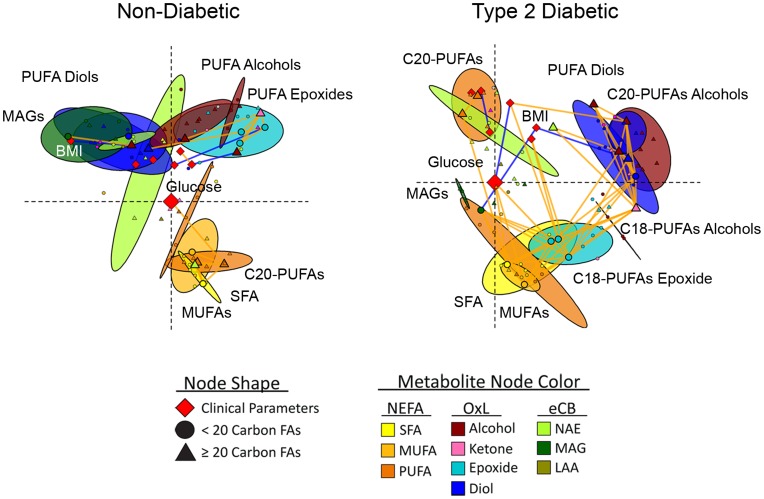
Figure 4. Parameter connectivity networks of metabolites and clinical parameters in African-American women with and without type 2 diabetes.
Spearman’s correlations were used to generate multi-dimensionally scaled parameter connectivity networks for variable intercorrelations. Networks were oriented with fasting glucose at the origin and SFA in the lower right quadrant. Colored ellipses represent the 95% probability locations of metabolite classes (Hoettlings T2, p<0.05). Nodes indicate clinical parameters (diamonds), <20-carbon fatty acid metabolites (circles) and ≥20-carbon fatty acid metabolites (triangles), with discriminant model variables and glucose enlarged. Significant correlations between species are designated by orange (positive) or blue (negative) connecting lines (p<0.05, non-diabetic; p<0.01, diabetic participants).

