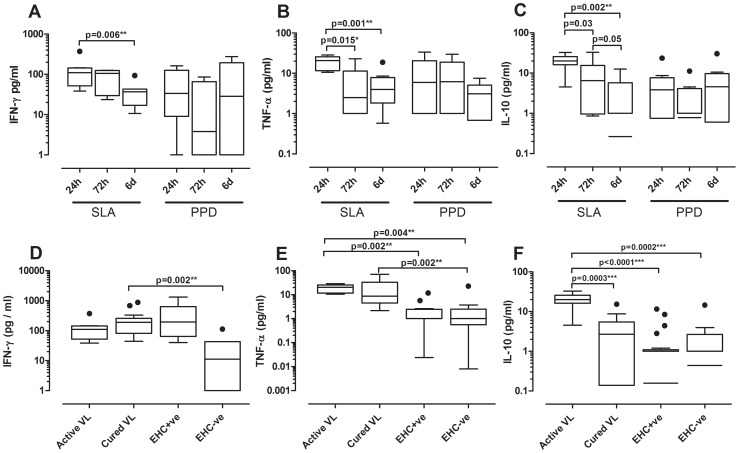
Figure 1. SLA-specific IFN-γ, TNF-α and IL-10 responses.
Box plots (Tukey) for cytokine production by peripheral whole blood cells in response to SLA (an Indian L. donovani strain, 10 µg/mL), or PPD (5 µg/mL) examined in active VL (n = 8), cured VL (n = 16), EHC+ve (n = 20) and EHC−ve (n = 9) groups by ELISA. (A–C) provide comparisons of cytokine levels over 24 hours, 72 hours and 6 days post stimulation with SLA or PPD in the active VL group (parallel data for IFN-γ responses in the cured VL group are provided in Fig. S1). (D–F) compare cytokine responses at 24 hours post stimulation across the 4 study groups. Antigen-stimulated cytokine responses are provided after subtraction of the non-stimulated control wells. Statistical differences between groups determined using the non-parametric Man-Whitney test are indicated by bars above columns, * indicates p<0.05, ** p<0.01, and *** p<0.001.

