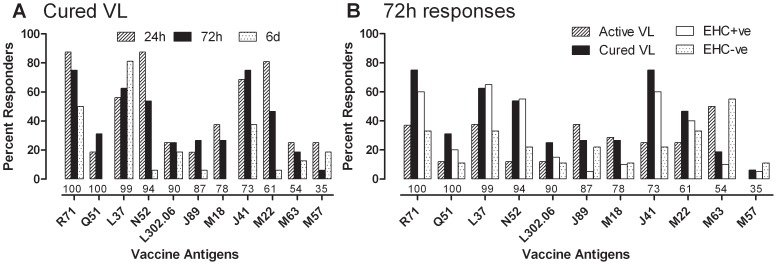
Figure 5. IFN-γ responses to peptide pools for 11 novel defined leishmania antigens.
Bar graphs indicating the percentage of responders to peptide pools (5 µg/mL) for each of 11 novel antigens (A) at 24 hours, 72 hours and 6 days post stimulation for the cured VL group, and (B) across active VL (n = 8), cured VL (n = 16), EHC+ve (n = 20) and EHC−ve (n = 9) groups at the 72 hour time point. Numbers immediately under the bars indicate the percent identity between the originally sequenced L. major proteins and their L. infantum orthologues. See also tables S1 and S2.

