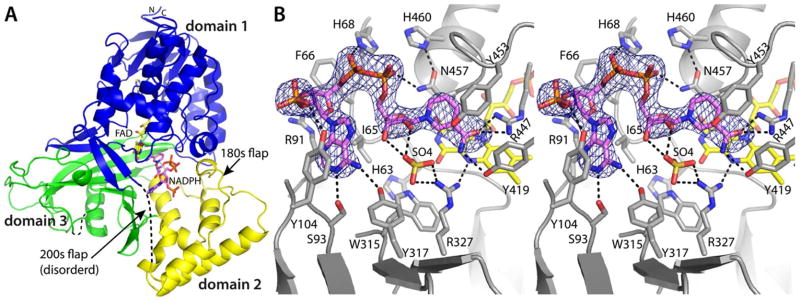
Figure 2.
Crystal structure of AfUGMo complexed with NADPH. (A) Protomer structure. FAD and NADPH are colored yellow and pink, respectively. Domains 1, 2, and 3 are colored blue, yellow, and green, respectively. (B) Stereographic view of the NADPH binding site. The cage represents a simulated annealing σA-weighted Fo − Fc omit map (3.0 σ). Prior to calculating the map, NADPH was omitted and simulated annealing refinement was performed.

