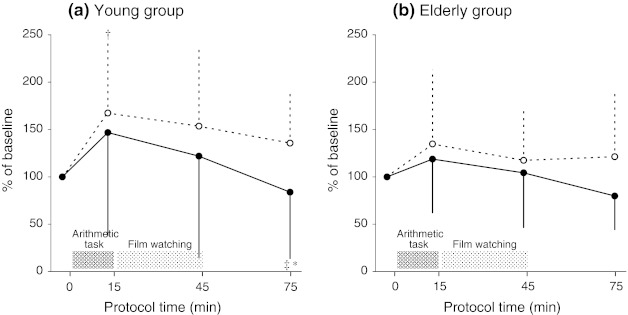
Fig. 3.
Mean values (±SD) normalized as percentage of the baseline (0 min) value for salivary chromogranin A (CgA) levels in samples taken during the comic film protocol (open circles, solid line, n = 15) and in control samples (filled circles, dashed line, n = 15). †, ‡Statistically significant difference (p < 0.05) compared with 0 and 15 min, respectively (repeated measures ANOVA and Bonferroni’s test). *Statistically significantly different (p < 0.05) from the control protocol (Student’s paired t test)

