Fig. 3.
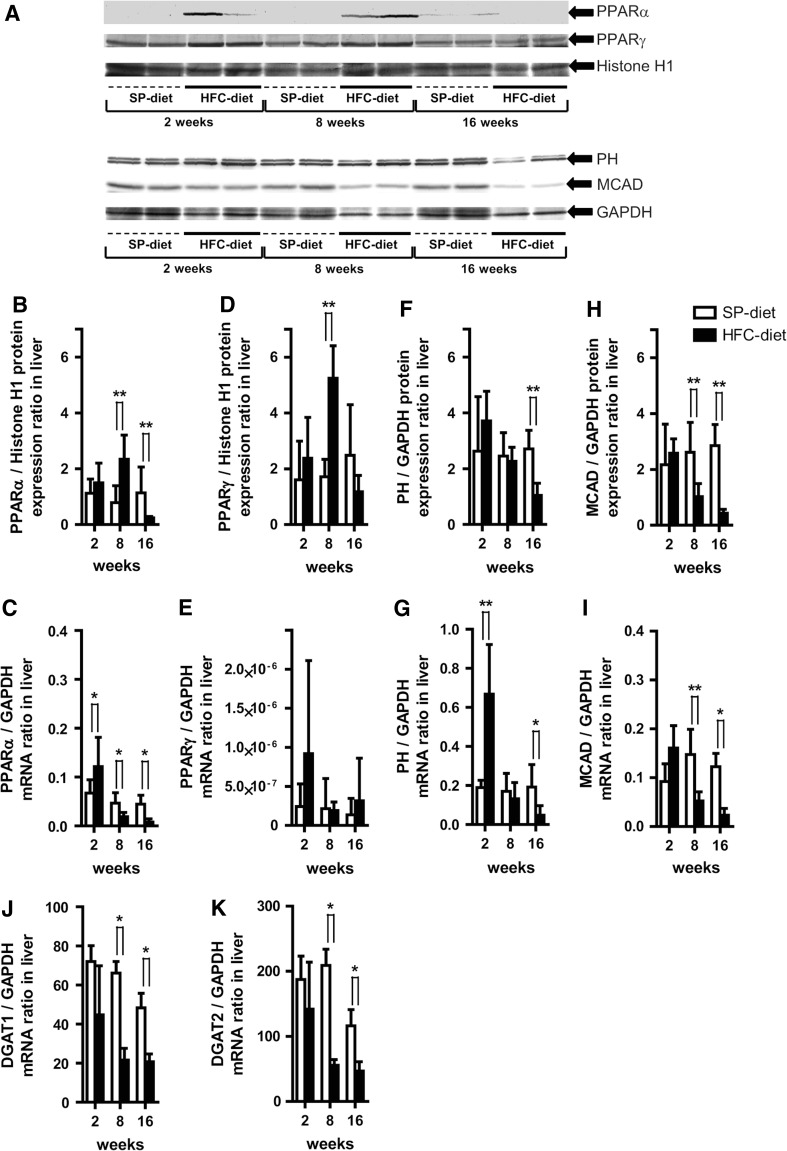
Effects of HFC-diet treatment on hepatic peroxisome proliferator-activated receptor α and γ (PPARα, PPARγ), peroxisomal bifunctional protein (hydratase + 3-hydroxyacyl-CoA dehydrogenase) (PH), medium chain acyl-CoA dehydrogenase (MCAD), diacylglycerol acyltransferase 1 and 2 (DGAT1, DGAT2) protein and mRNA expressions. a Western blot results of respective protein expressions in whole liver tissue homogenates or nuclear fractions. b, c Hepatic PPARα protein (b) and mRNA expression (c) ratios. d, e Hepatic PPARγ protein (d) and mRNA expression (e) ratios. f–i Ratio of hepatic protein and mRNA expressions for PH (f, g) and MCAD (h, i). j, k Hepatic DGAT1 (j) and DGAT2 (k) mRNA expression ratio. Each histogram represents a mean ratio ± SD. *p < 0.05, **p < 0.01 compared with the SP-diet group within each diet–treatment period

