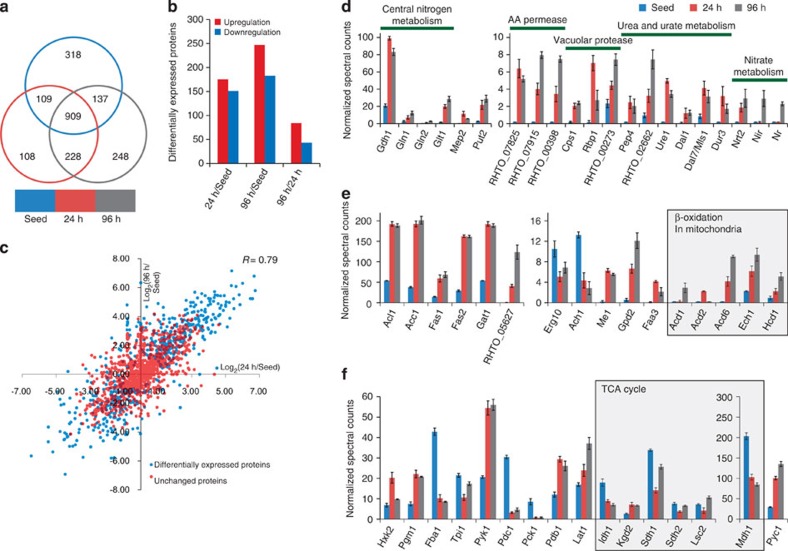
Figure 5. Comparative proteomic analysis of R. toruloides during lipid production.
(a) The overlap of proteins (at least two occurrences within three replicates) that were identified by LC-MS/MS in the 'Seed' (the preculture, which was in YPD medium for 36 h; lipid content 9.8%), “24 h” (the culture in nitrogen-limited medium for 24 h; lipid content 37%) and '96 h' (the culture in nitrogen-limited medium for 96 h lipid content 63%) samples. (b) The number of differentially expressed proteins between the 'Seed', '24 h' and '96 h' samples. (c) Correlation analysis of proteins that were found in the '24 h' and '96 h' samples. (d) Upregulated proteins that were related to the NCR process. (e) Expression level changes of proteins that were involved in lipid metabolism. (f) Expression level changes of proteins that were involved in central carbon metabolism. The average±s.e.m. of the normalized spectral counts (y axis) is presented (for d, e and f).

