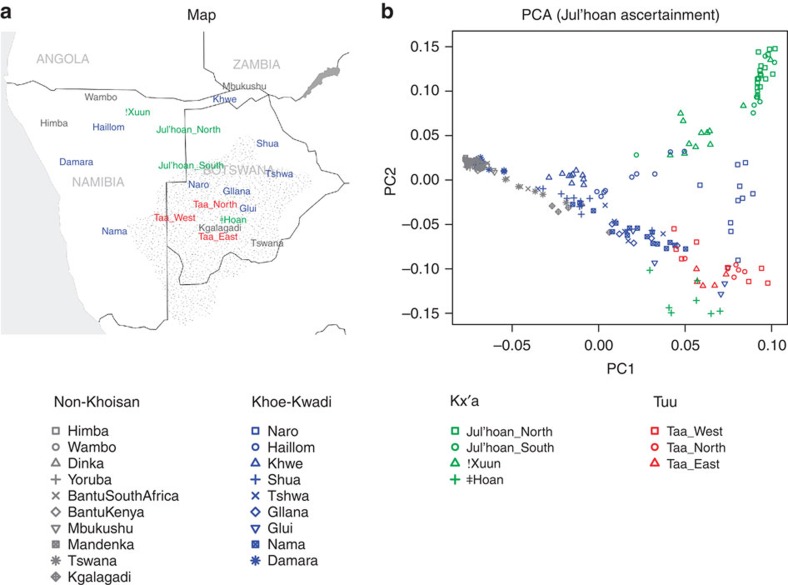
Figure 1. Population structure in southern Africa.
(a) Approximate locations of sampled populations. Populations are coloured according to linguistic affiliation, as indicated in the legend and Supplementary Fig. S1. The speckled region is the Kalahari semi-desert. (b) PCA on SNPs ascertained in a Ju|'hoan individual. Shown are the positions of each individual along the first and second axes of genetic variation, with symbols denoting the individual's population and linguistic affiliation using the same colour coding as in panel a.

