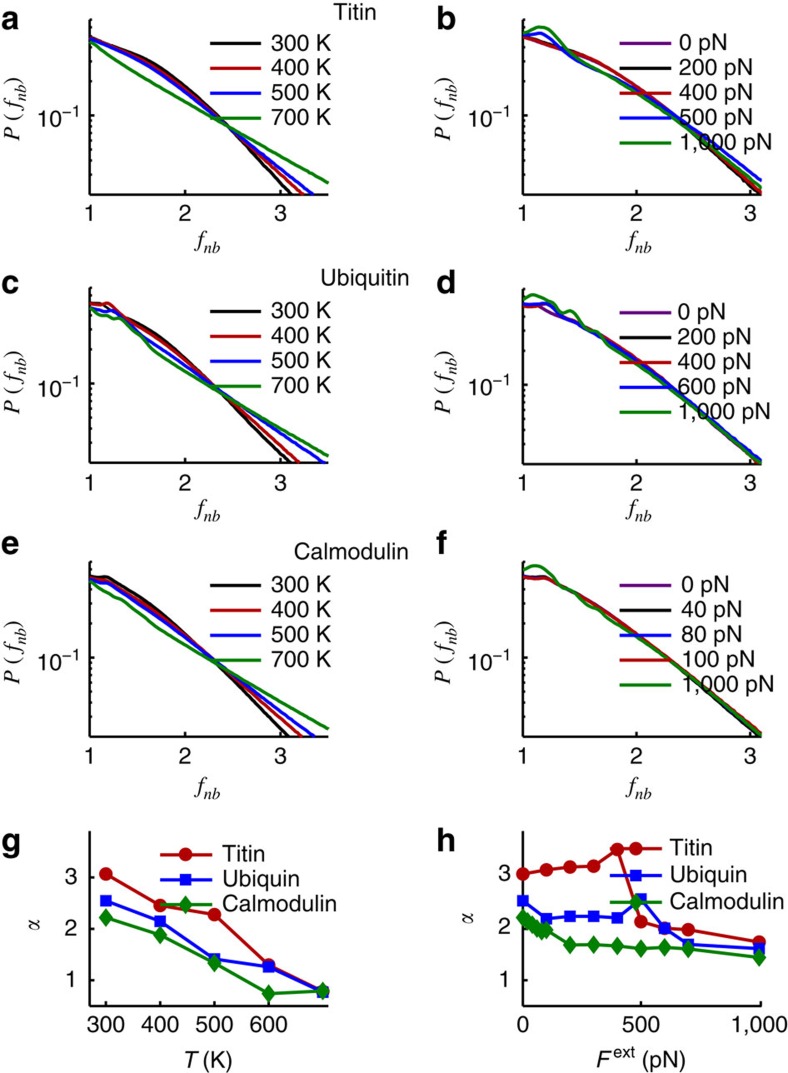
Figure 3. Temperature- versus force-induced unjamming.
Peak disappearance upon temperature and force unfolding for the three proteins studied. Semi-log plot of force distribution Pnb(fnb) for non-bonding interactions against scaled force fnb. Variation of Pnb(fnb) under different Ts shown in a,c,e, and under different Fext in b,d,f for titin (a,b), ubiquitin (c,d) and calmodulin (e,f). For high Fext forces (that is, beyond unfolding, for example, green curve in Fig. 3b), note the additional ‘ripples' appearing for small fnb in accord with data on triangular lattices under increasing anisotropy of shear (cf., for example, Fig. 5 in ref. 46 and references therein). Variation of exponent α (a measure of peak size) against T in panel g, and α against Fext in h. The magnitude of α (see text) correlates with the mechanical unfolding resilience and may be considered as a measure of the amount of stress stored in the non-bonding interactions. Titin, which has highest value of α, is one of the strongest proteins found in nature.

